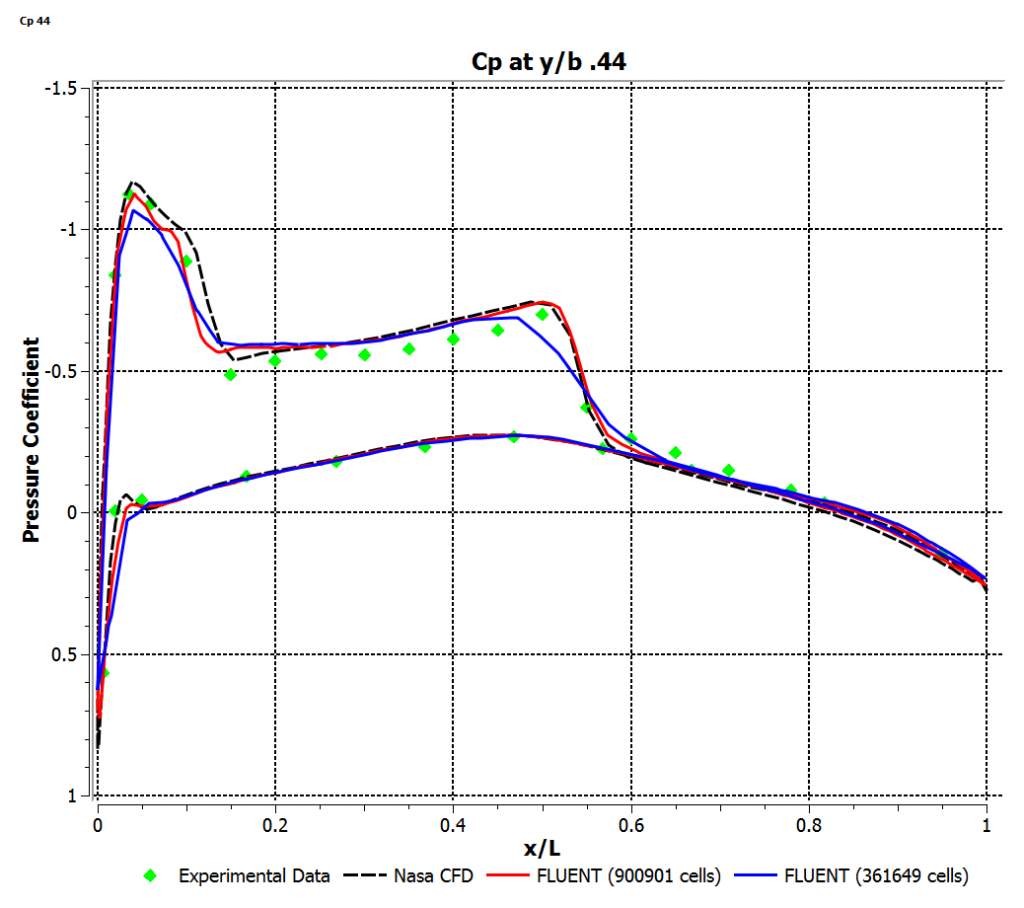
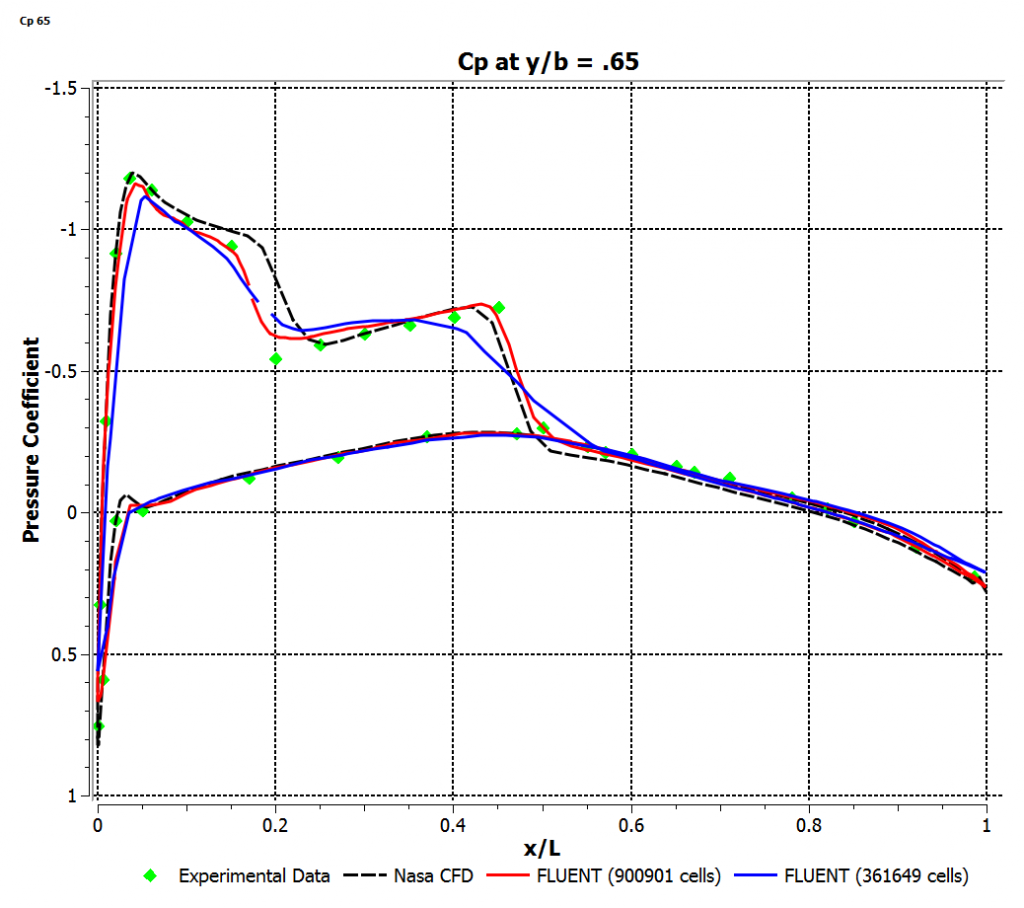
Validation
We validate our simulation results by comparing Fluent data with experimental data for the Onera M6 wing. We plot the pressure coefficient at different spanwise locations of the wing and compare the results. Here we have plotted the pressure coefficient for the spanwise locations y/b = .44, .2, and .65. We see that if we continue plotting the pressure coefficient spanwise, the results become less accurate due to the 3-dimensional effects far from the symmetry plane. In our plots, we have the first coarse mesh and results from our more refined mesh compared with CFD from NASA and the experimental results.
References
Comparison data was obtained from NASA's Glenn Research Center validation archive:
- Slater, John W. "ONERA M6 Wing Study #1." ONERA M6 Wing. NPARC, n.d. Web.


