-
-
July 8, 2024 at 10:12 am
 SolutionParticipant
This article is part of an embedded Human Machine Interface (HMI) design blog series. It details the process of designing a next generation embedded HMI for the control of an industrial steam boiler and implementing it with Ansys SCADE. You can find links to each part below:
- Part 1 – Designing a next-gen embedded HMI
- Part 2 – Implementing a next-gen HMI in SCADE Display
- Part 3 – Powering a next-gen HMI with SCADE Suite
- Part 4 – Integrating a next-gen HMI onto a hardware target
Introduction
This article presents an overview of the implementation, in SCADE Suite, of the logic supporting a next-gen embedded HMI for an industrial steam boiler.
The steam boiler is like the one you’d find in a nuclear power plant. It uses a heat source (e.g. nuclear fuel) to produce steam. It is controlled by a reactive control loop that balances sensor readings (temperature, steam pressure, water level) within acceptable parameters by using actuators (water injection valves).
In our previous article, we used SCADE Display to implement the HMI panel. We will now use SCADE Suite to implement the logic behind it.
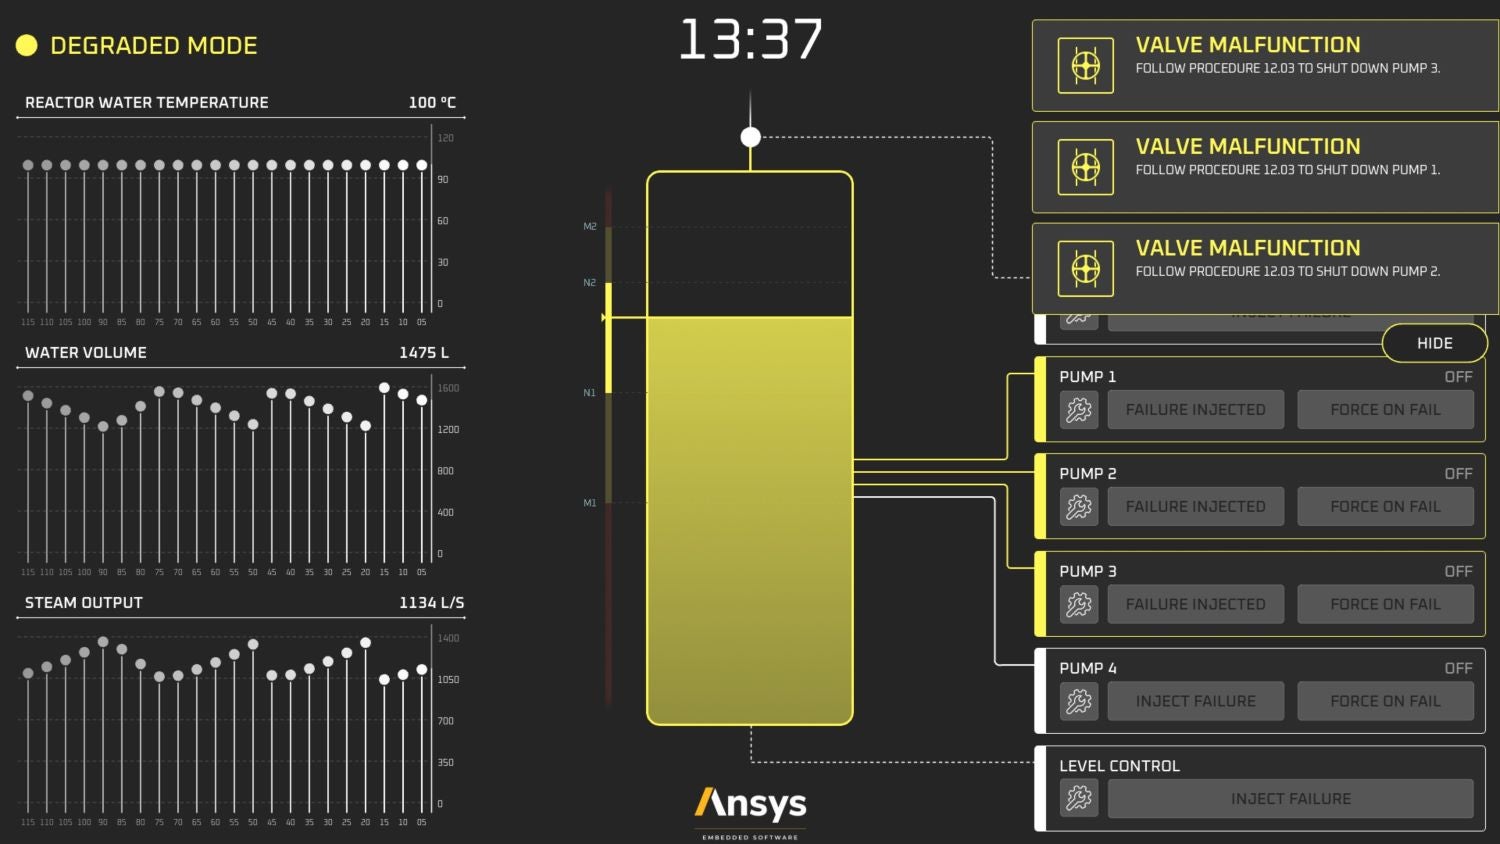
As a reminder, here is what our graphical panel looks like:
SCADE Suite
Ansys SCADE Suite is a specialized tool used to produce reliable and safe embedded software. It is model-based: users define their program by drawing block diagrams. The resulting behavior is dataflow-oriented and is used as a reference to generate safe, embeddable C code.
This is what our user interface looks like during implementation:
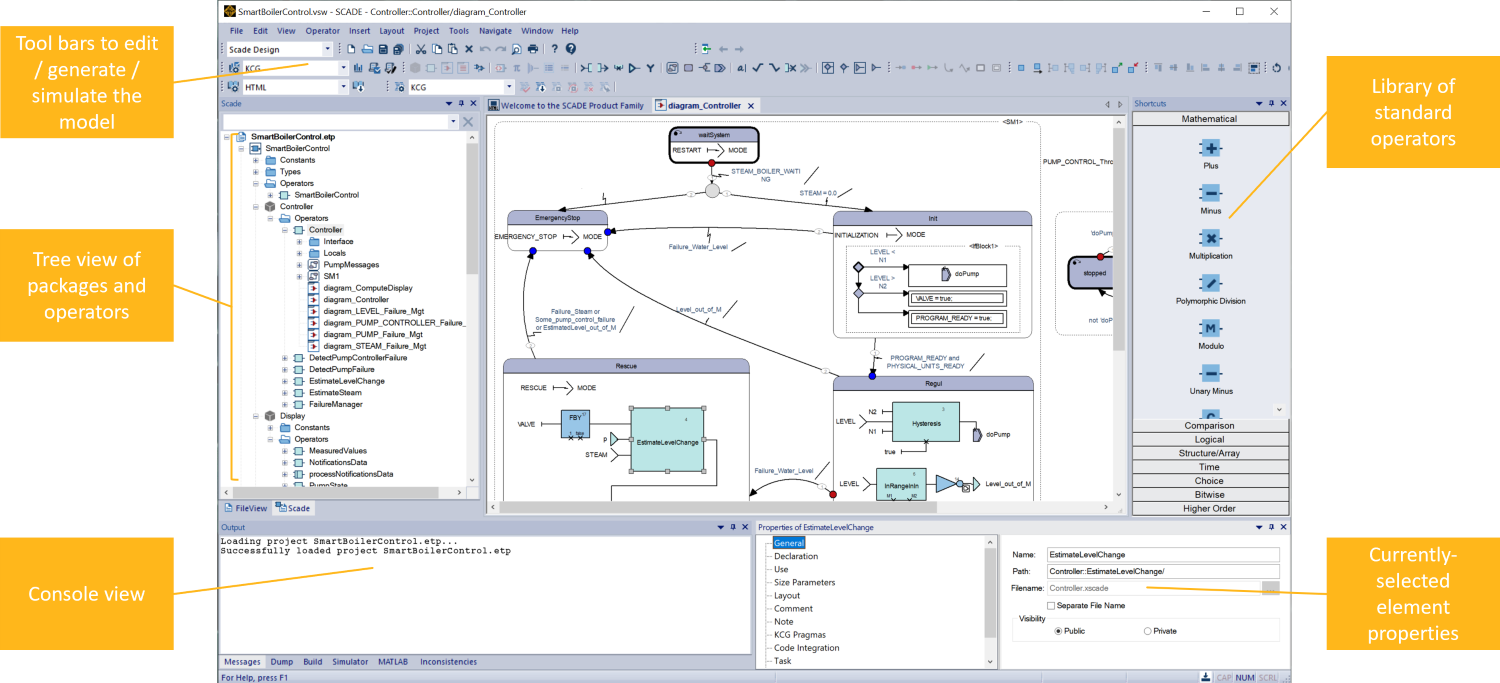
SCADE Suite user interface with a control logic diagram open, featuring a state machineApplication architecture
The overall architecture of the application looks like this:
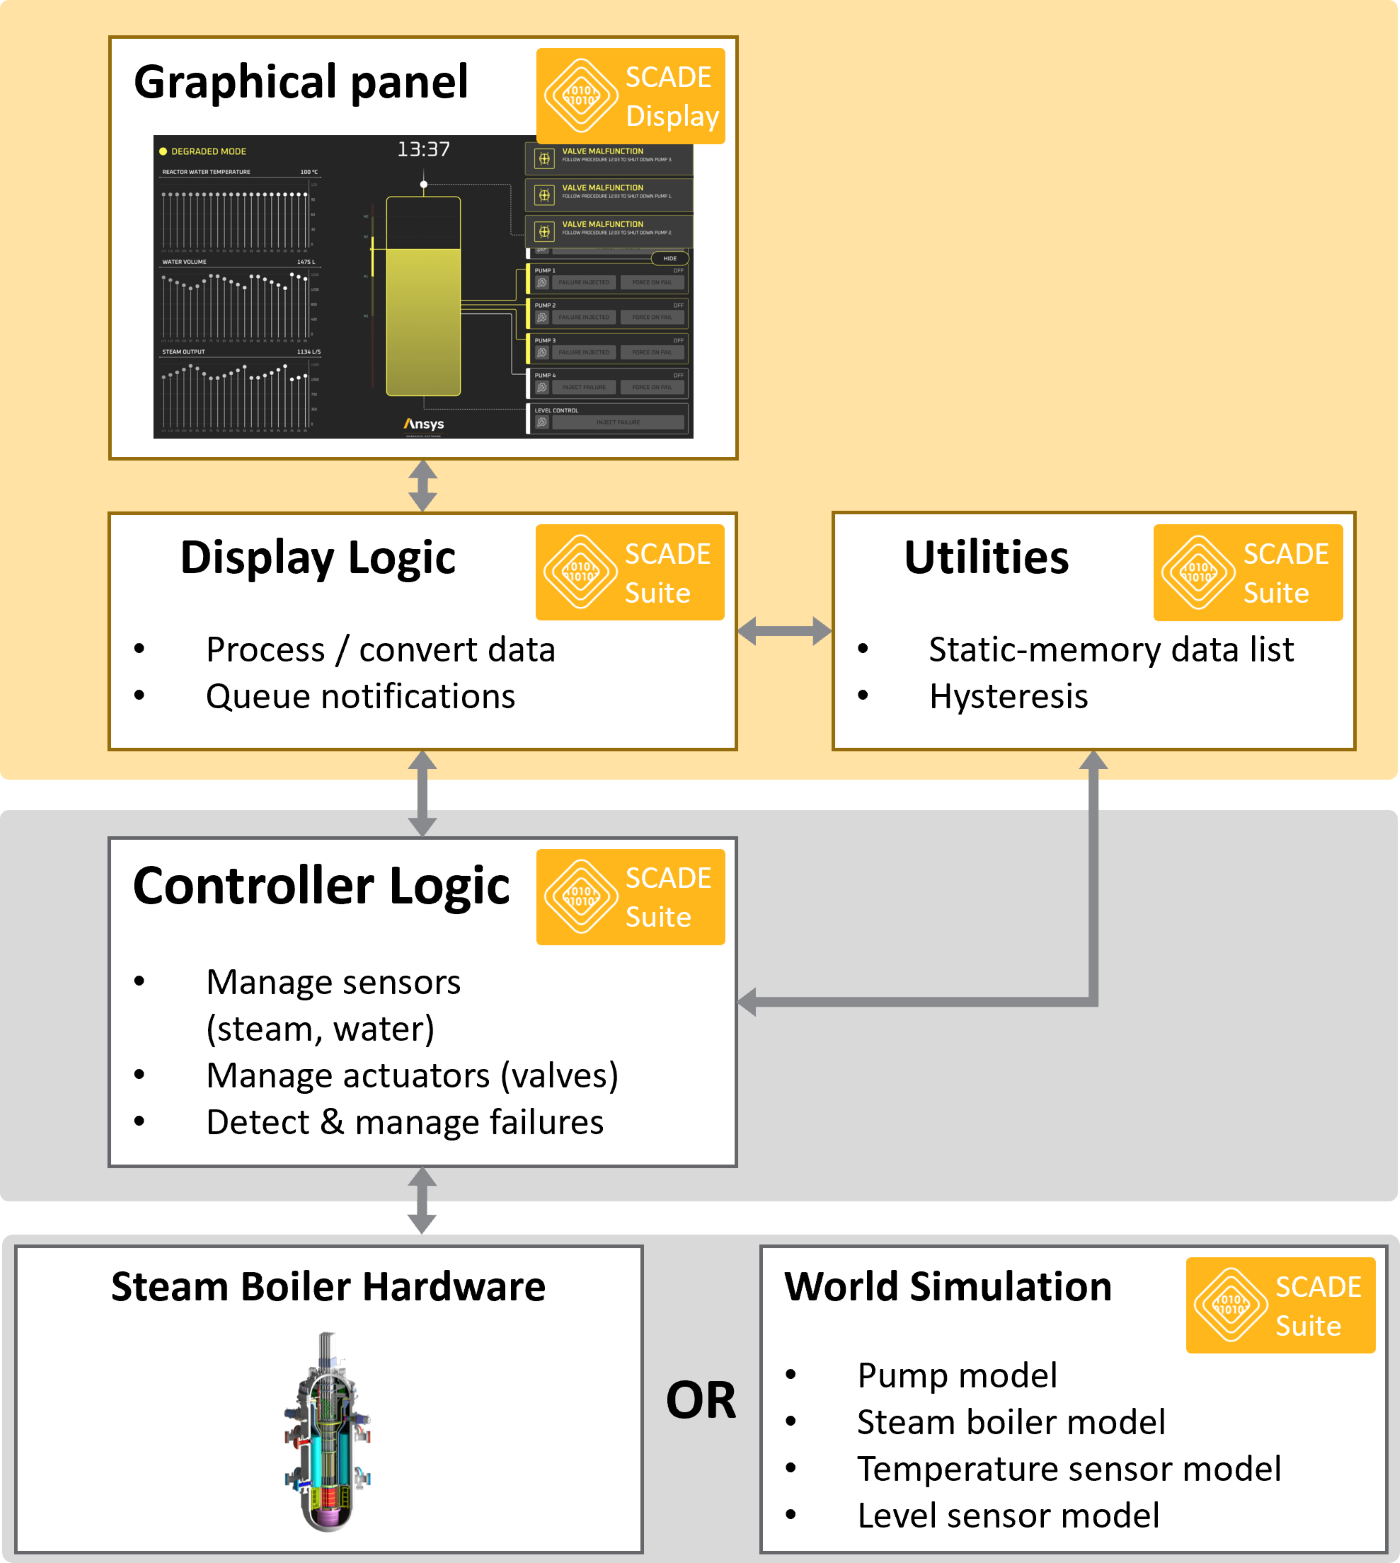
High-level architecture diagram for our smart boiler’s control logicThe embedded software is composed of several pieces developed with SCADE. Each white box with a SCADE badge represents one package of the overall SCADE model. The SCADE code generator then produces embeddable, safe, platform-independent C code from this model.
This article will focus on the yellow piece up top: the logic directly connected to the graphical panel.
Let’s walk through the diagram.
At the top, we find the graphical panel we implemented last time using SCADE Display.
In the middle, the SCADE Suite program follows a typical architecture. SCADE Suite Packages organize the model into several sections:
- Display Logic (
Displaypackage): this layer is directly plugged into the graphical panel. It focuses on managing / converting values and passing them between the graphical panel and the controller. It can be seen as a “glue” layer between both worlds. It will be our focus for today. - Utilities (
Utilities&ListOfDatapackages): these are generic functions that facilitate computations. For instance, it provides helper operators to manage lists of elements, or to determine whether value changes went over a threshold. - Controller Logic (
Controllerpackage): this is the business logic layer. This part of the model reads sensor data, decides how to respond using the actuators, and manages failure modes.
Finally, at the very bottom, we find the actual hardware of our steam boiler: physical sensors and actuators that interface with our software.
For the purposes of testing our program, these can be replaced with what control engineers call a Plant Model: a simulated version of these sensors and actuators, using mathematical models to simulate the underlying physical phenomena they interact with. For this example, we have developed this part in SCADE Suite, to support model-level testing and ensure the correctness of our program.
Implementation
We will now focus on two key aspects of the Display Logic package. They will provide a detailed view of how specific pieces of the implementation are done:
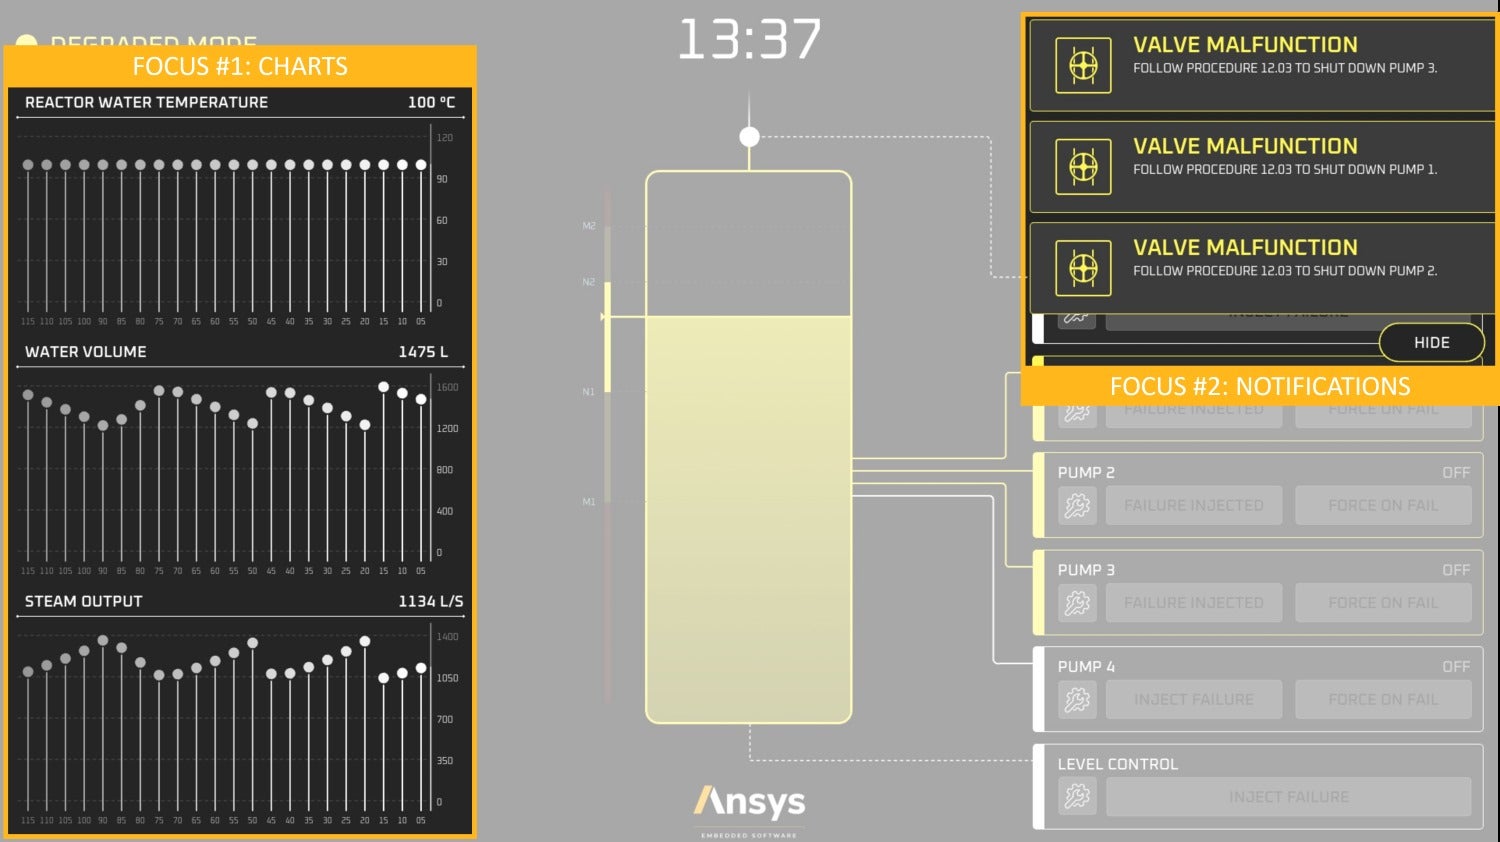
Our two areas of focus: charts (left) and notifications (top right)Focus #1 – Charts
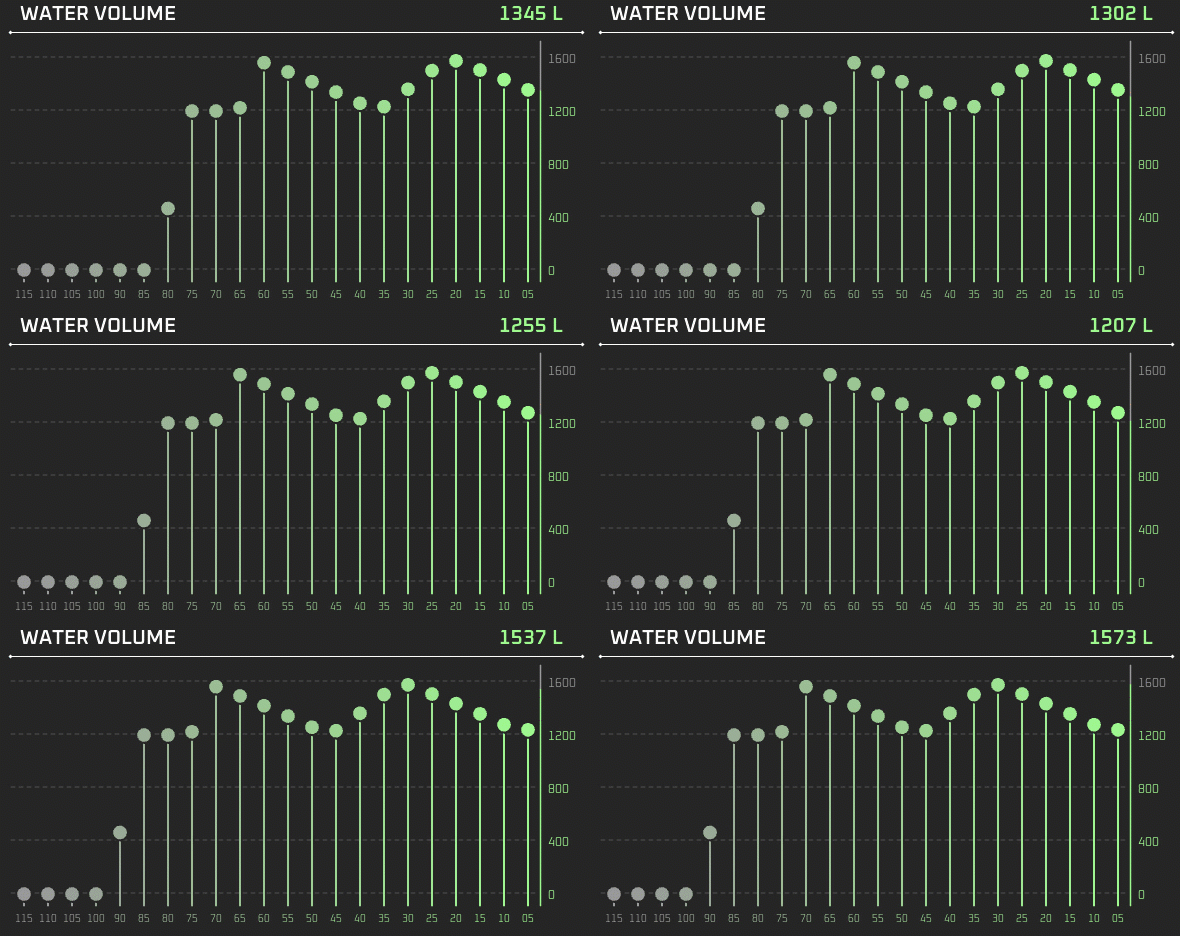
Our first focus is on the charts that appear on the left-hand side of the embedded HMI.
In SCADE, there is no dynamic memory allocation. This is mandatory in safety-critical applications that run on memory-constrained embedded targets. Therefore, to plot the history of data points for various sensor values, we use a fixed-size array of 22 floating-point values. Every time a new value is received, it is added to the right of the array, shifting all previous values left (and discarding the oldest value).
SCADE Display offers the ability to insert imported C code. We have chosen to use it to implement the rolling history of data points. While we could have implemented the logic in SCADE Suite, we wanted to illustrate how existing manual code can be integrated into a SCADE application.
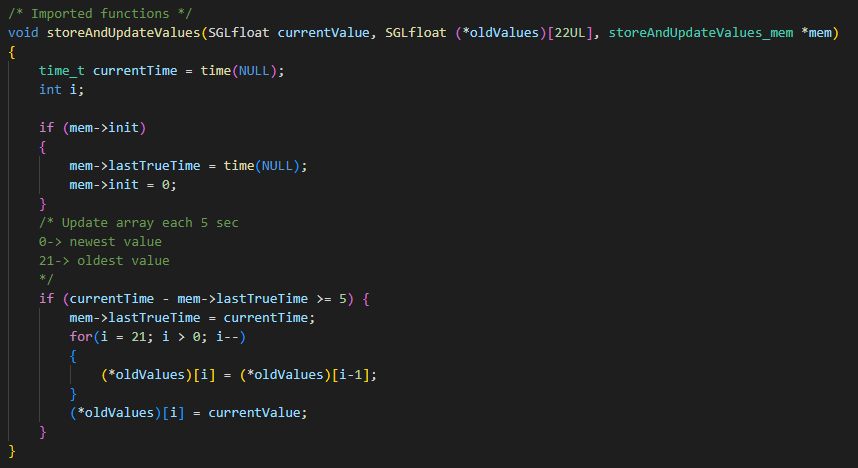
Here’s the code:
The function
storeAndUpdateValuesis designed to store the current value into a rolling array of previous values, and to update this array at most every 5 seconds to ensure that the values are updated at a controlled rate.The function has 3 parameters:
currentValue: the new value to be added to the arrayoldValues: a pointer to a fixed size arraystoreAndUpdateValues_mem: A pointer to astructthat holds the function’s memory state between calls
The
oldValuesarray operates in a First-In, Last-Out (FILO) manner:- Index
0holds the newest value. - Index
21holds the oldest value.
This way, the array always contains the most recent 22 values, updating them every 5 seconds.
This function is a good example of how to manage a rolling history of data points in a fixed-size array with periodic updates. It is particularly useful in applications that require periodic sampling of data, such as sensor readings or real-time monitoring systems.
To connect each chart to its rolling list, we use SCADE Display’s concept of plugs. A plug is a named variable that can be connected to a SCADE Suite property (input or output of an operator).
Focus #2 – Notifications
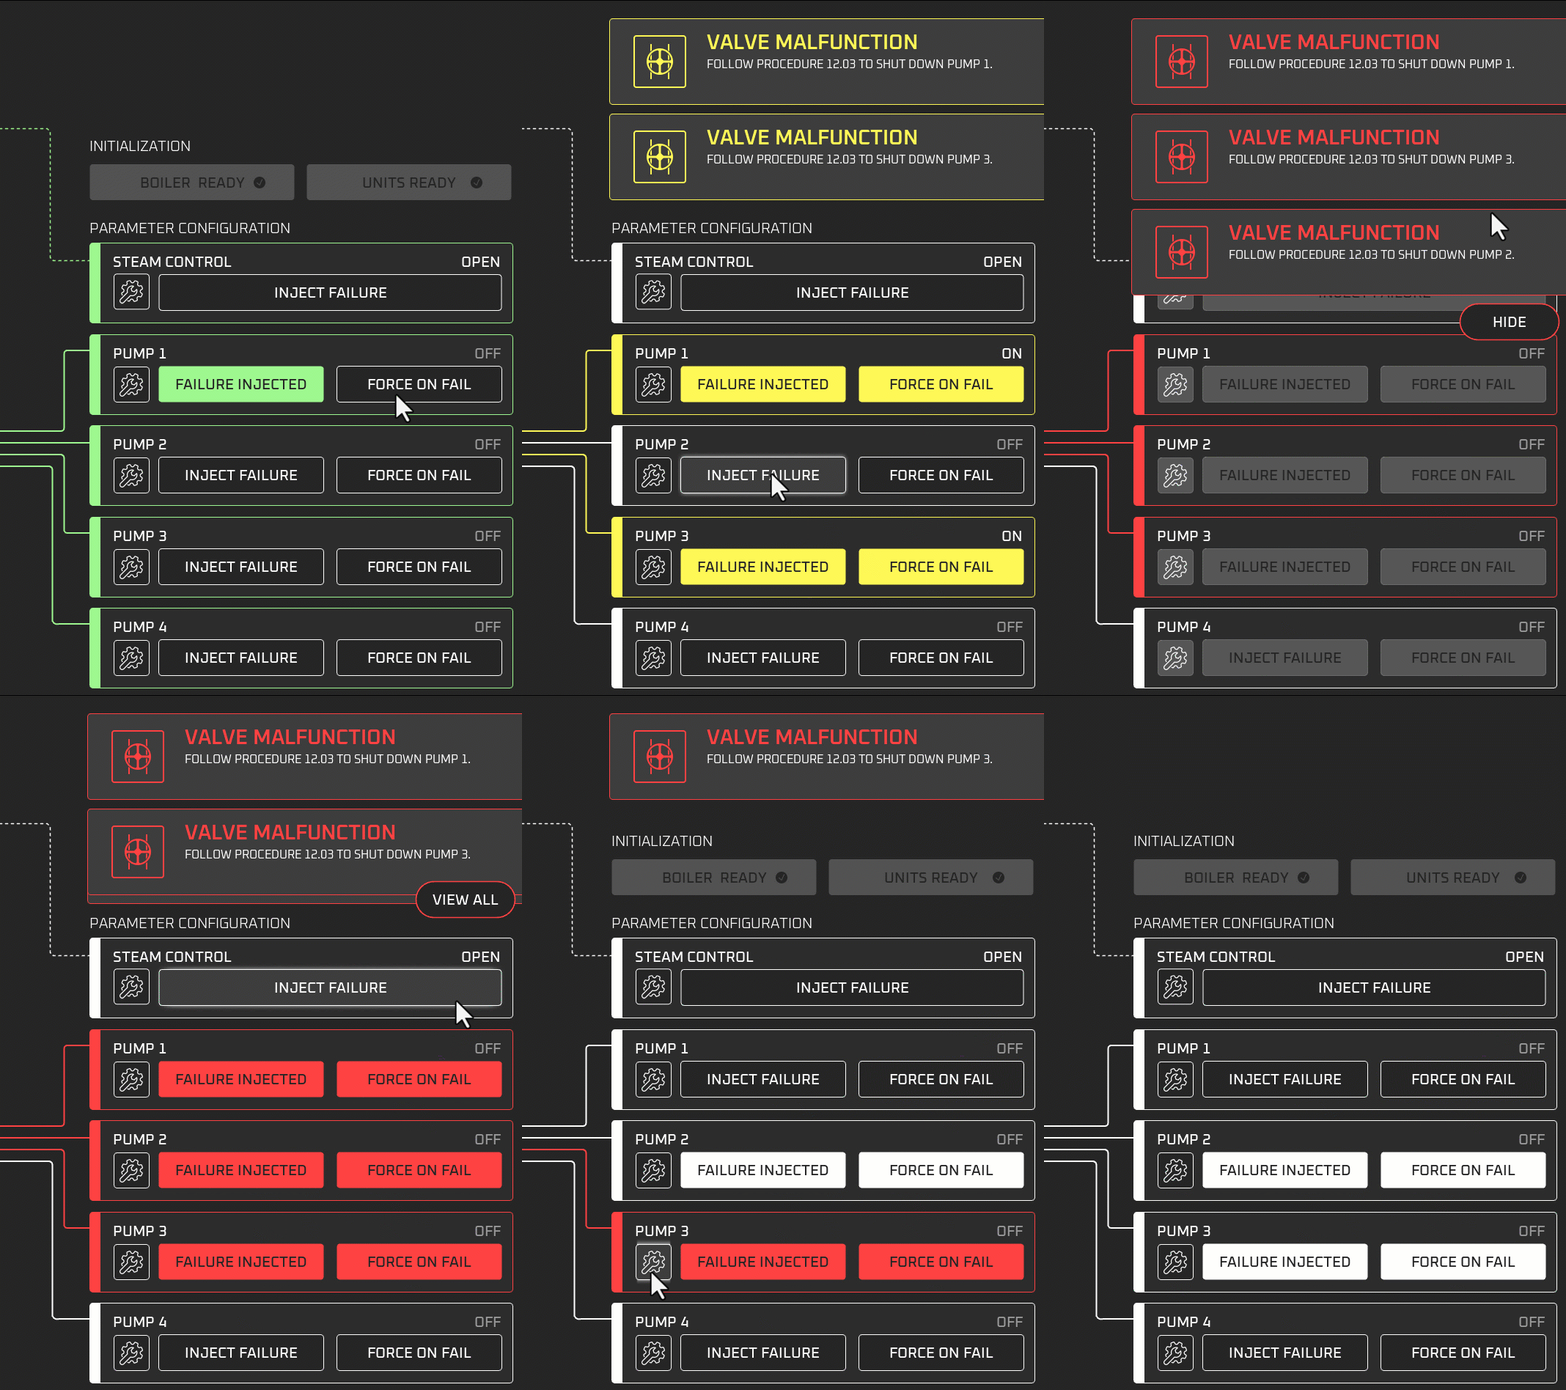
User notifications stack to track boiler malfunctionsLet’s look at how the model manages a queue of notifications, ensuring that notifications can be added and removed efficiently. This functionality is critical in systems where events must be processed in order, such as alerting systems.
Key Components of the Model:
- Notification Queue: A data structure to hold the notifications.
- Collections Library: A library providing functions to manage the queue, such as adding and removing elements.
- Add Notification Function: Adds a new notification to the queue, leveraging the collections library.
- Remove Notification Function: Removes the selected notification from the queue, leveraging the collections library.
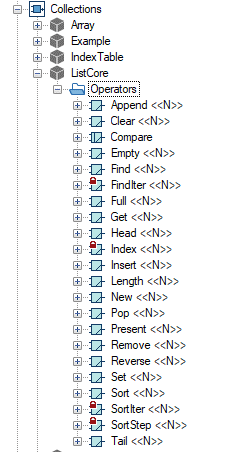
The SCADE Collections library provides pre-built components for managing data structures like queues and lists. In the model, it abstracts the complexity of managing a queue, providing a simple interface for some functions. In our case, only the Append and Remove operators are used.
First, we define a data type for the notification. For simplicity, we choose an
int32field calledkind:
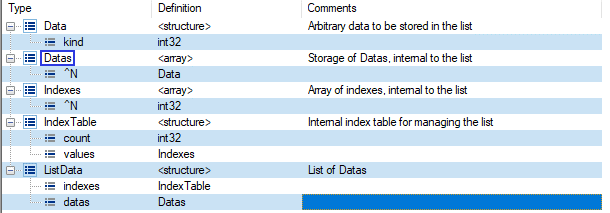
Data structure manipulated by the listThis value encodes the kind of notification that is to be displayed (e.g. a pump failure).
We then create a queue to store notifications:
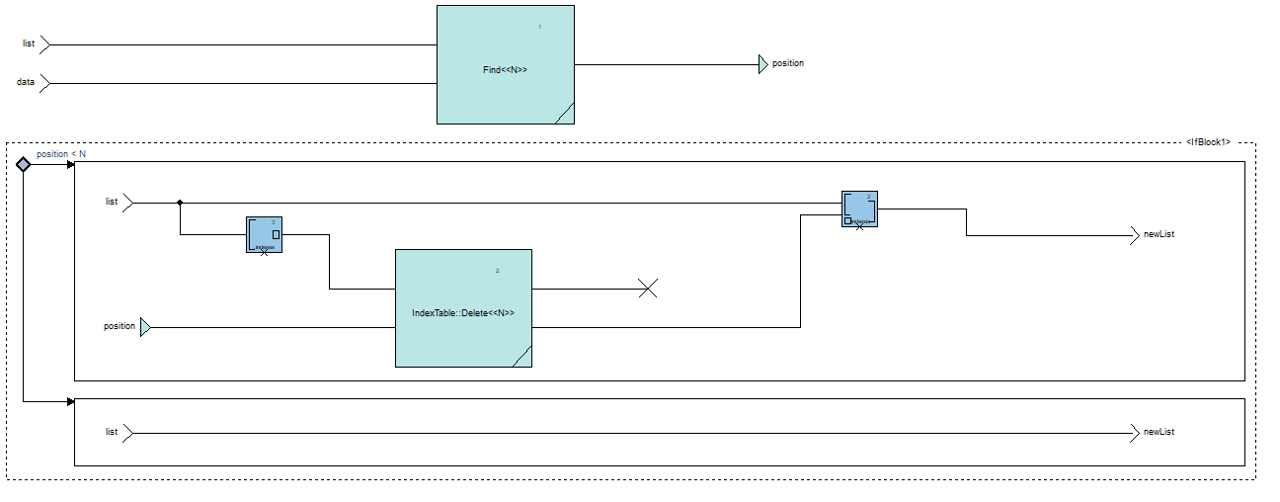
Now, we can implement two simple operators, leveraging the Collections library to Append/Remove notifications:
Append inserts at the end of the list. Remove searches for the item and removes it. In both cases, the diagram manipulates data flows: we take a list as input and return a new list as an output.
These functions are integrated into the main model where the system logic determines when to append or remove notifications:
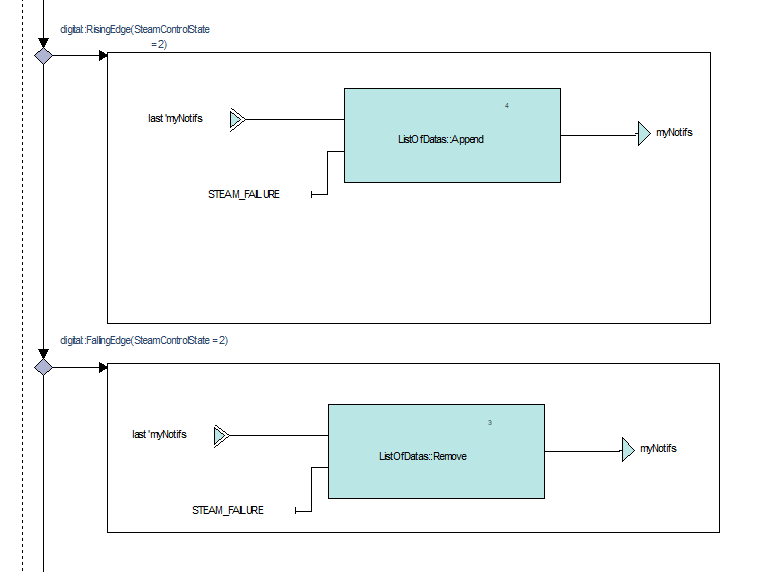
IfBlock managing the addition & removal of notificationsAt this stage, using SCADE Suite and its Collections library, we have created a model to manage our notification queue.
We can now plug this data structure into our SCADE Display model, where a
Notificationwidget allows us to display a notification according to its kind (with the same integer values encoding which notification to show):
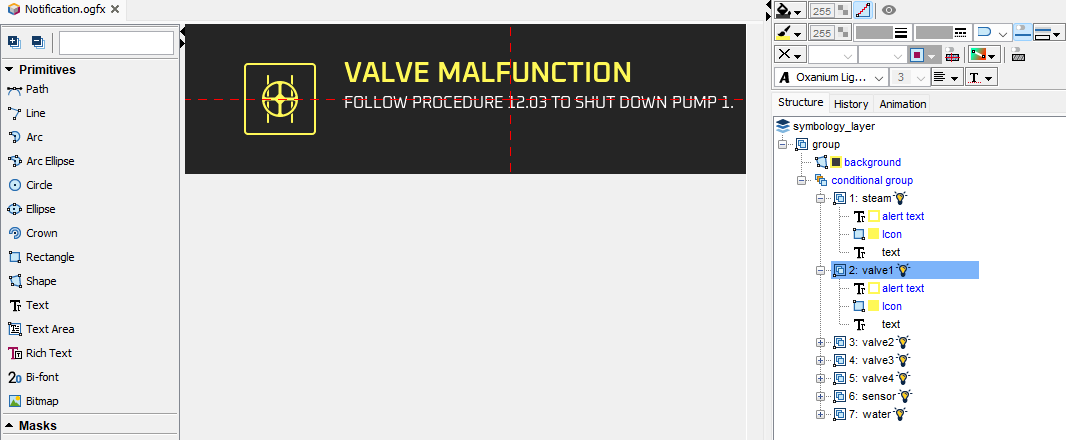
Notification widget in SCADE DisplayThis low-level widget is used in another
Notifications(with an ‘s’) widget that allows the on-screen display of multiple notifications according to the queue managed in the SCADE Suite model:
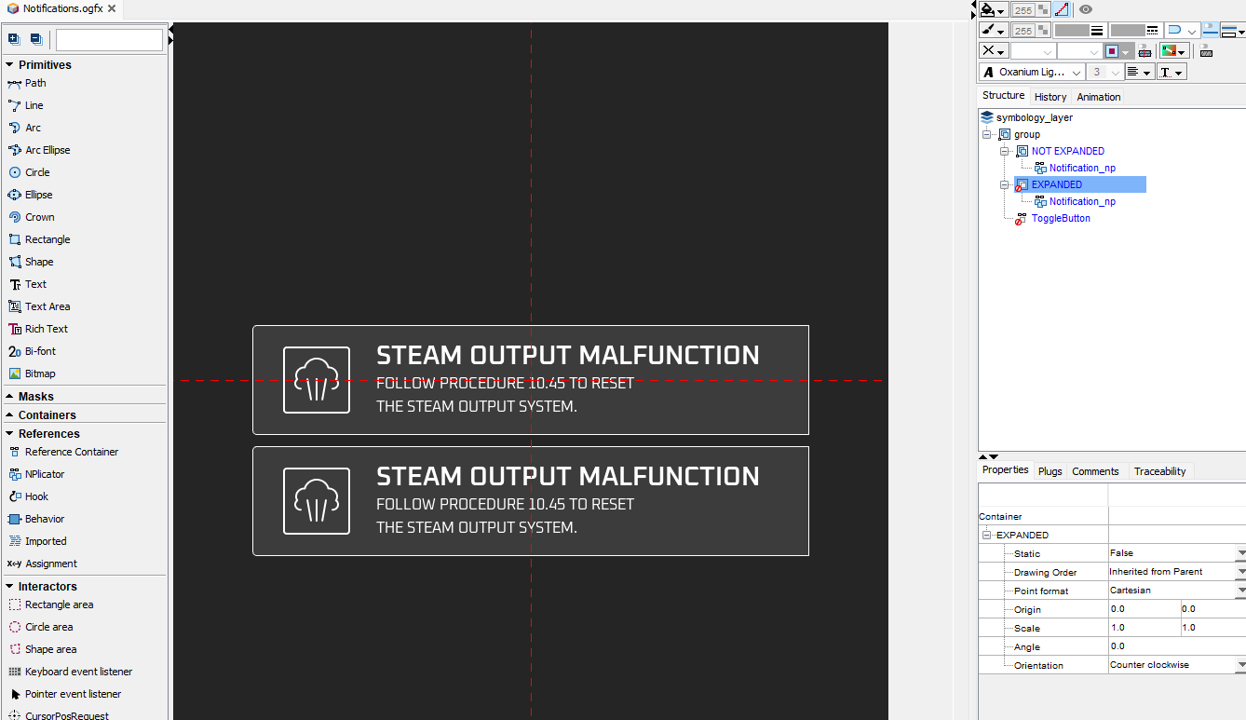
Notifications widget in SCADE DisplayThe
Notificationswidget is then paired with a SCADE Suite operator, calledNotificationsData, that takes as an input the individual failure states, and builds a list of notifications:
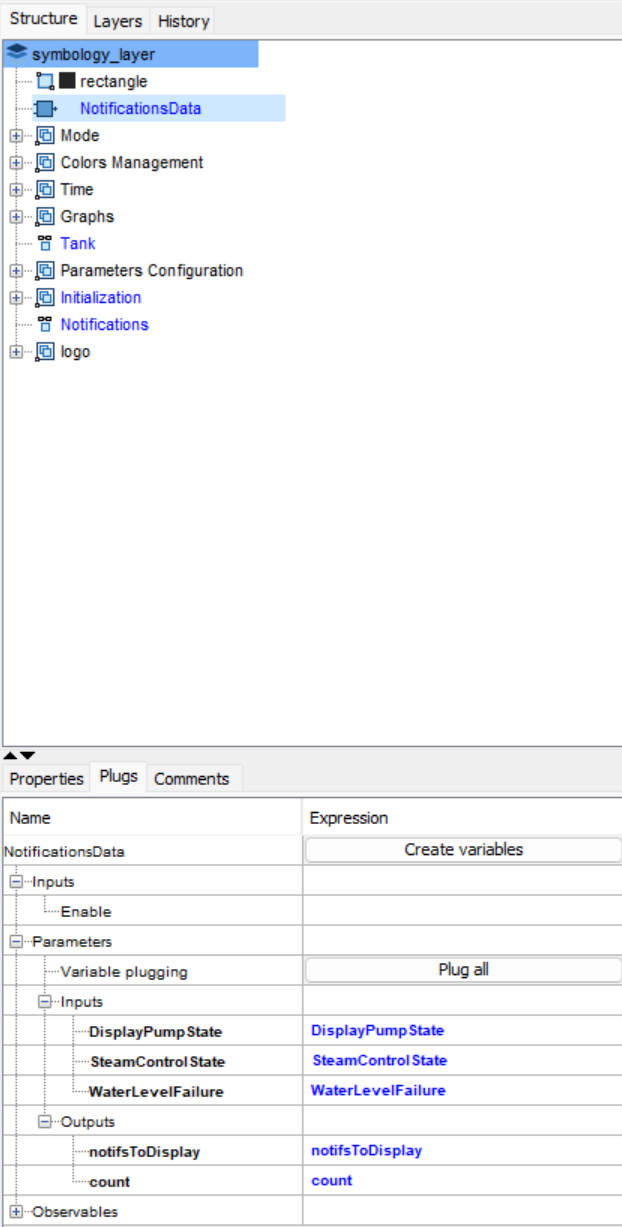
NotificationsData converts failure states into a notification listStay Tuned!
In this blog, we looked at the implementation of the logic for an embedded HMI in SCADE Suite, piloting our SCADE Display graphical panel.
In the next blog, we will conclude this series with the generation of a binary for a real-time hardware target.
About the authors
Ludovic Oddos (LinkedIn) is a Lead Product Specialist at Ansys. He has been supporting SCADE field engagements, in many industries, for more than 15 years. He has deep expertise in embedded software and its integration into various target environments.
François Couadau (LinkedIn) is a Senior Product Manager at Ansys. He works on embedded HMI software aspects in the SCADE and Scade One products. His past experience includes distributed systems and telecommunications.
-


Introducing Ansys Electronics Desktop on Ansys Cloud
The Watch & Learn video article provides an overview of cloud computing from Electronics Desktop and details the product licenses and subscriptions to ANSYS Cloud Service that are...
How to Create a Reflector for a Center High-Mounted Stop Lamp (CHMSL)
This video article demonstrates how to create a reflector for a center high-mounted stop lamp. Optical Part design in Ansys SPEOS enables the design and validation of multiple...
Introducing the GEKO Turbulence Model in Ansys Fluent
The GEKO (GEneralized K-Omega) turbulence model offers a flexible, robust, general-purpose approach to RANS turbulence modeling. Introducing 2 videos: Part 1 provides background information on the model and a...
Postprocessing on Ansys EnSight
This video demonstrates exporting data from Fluent in EnSight Case Gold format, and it reviews the basic postprocessing capabilities of EnSight.

- An introduction to DO-178C
- Scade One – Bridging the Gap between Model-Based Design and Traditional Programming
- ARINC 661: the standard behind modern cockpit display systems
- Scade One – An Open Model-Based Ecosystem, Ready for MBSE
- Scade One – A Visual Coding Experience
- Using the SCADE Python APIs from your favorite IDE
- How to integrate multiple SCADE models into one executable
- How to Verify a Model on Host with SCADE Test? (Part 4 of 6)
- Scade One – Democratizing model-based development
- Introduction to the SCADE Environment (Part 1 of 5)

© 2026 Copyright ANSYS, Inc. All rights reserved.

