Tagged: 2021 R1, General, mechanical, structural-mechanics
-
-
April 13, 2023 at 7:33 am
 SolutionParticipant
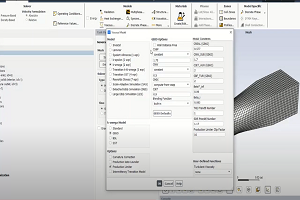
The temperature variation through thickness can be seen by activating following two options. Once you activate this option restart mechanical to activate it.
Attachments:
1. temperature.PNG
-


Introducing Ansys Electronics Desktop on Ansys Cloud
The Watch & Learn video article provides an overview of cloud computing from Electronics Desktop and details the product licenses and subscriptions to ANSYS Cloud Service that are...

How to Create a Reflector for a Center High-Mounted Stop Lamp (CHMSL)
This video article demonstrates how to create a reflector for a center high-mounted stop lamp. Optical Part design in Ansys SPEOS enables the design and validation of multiple...

Introducing the GEKO Turbulence Model in Ansys Fluent
The GEKO (GEneralized K-Omega) turbulence model offers a flexible, robust, general-purpose approach to RANS turbulence modeling. Introducing 2 videos: Part 1 provides background information on the model and a...

Postprocessing on Ansys EnSight
This video demonstrates exporting data from Fluent in EnSight Case Gold format, and it reviews the basic postprocessing capabilities of EnSight.

- How do I request ANSYS Mechanical to use more number of cores for solution?
- How to restore the corrupted project in ANSYS Workbench?
- How to deal with “”Problem terminated — energy error too large””?”
- Contact Definitions in ANSYS Workbench Mechanical
- There is a unit systems mismatch between the environments involved in the solution.
- How can I change the background color, font size settings of the avi animation exported from Mechanical? How can I improve the resolution of the video?
- How to transfer a material model(s) from one Analysis system to another within Workbench?
- How to obtain force reaction in a section ?
- How to change color for each body in Mechanical?
- How to resolve “Error: Invalid Geometry”?

© 2025 Copyright ANSYS, Inc. All rights reserved.

