You need to place Gauge points at the elements of the parts where fragments are created in your Autodyn model at the cycle 0, then run the model in Autodyn Component system or Autodyn Standalone. At the end of the running, you should be able to plot time history of displacement, velocity, pressure, or stress at the gauge points.
The variables at a gauge point include contour (element) variables such as pressure, energy, stress, strain, and nodal variables such as velocity, displacement. For stuructured (IJK based) mesh parts, the contour variables are always the variables at the center of the element where the gauge point resides. The nodal varibles are always the variables at the upper node that has the index (I, J, K) in the gauge element. For unstructured mesh parts, you can select ELEMENT when defining gauge points to record contour variables or select NODE when defining gauge points to record nodal variables.
Please keep it in mind that AUTODYN uses “contant stress” or “constant strain” solid element since a single integration point is used to speed up the computation. You can place a gauge point anywhere inside the element and this will always record the same value for element variables.
In the AUTODYN model at the cycle 0, you also need to click on OUTPUT on the left navigation bar, and then click on HISTORY -> SELECT GAUGE VARIABLES to pick the variables for your time history plots. You can click on OUTPUT -> SAVE -> REVIEW VARIABLES to view the descriptions of each variable.
After the calculation is done, you can plot pressure-distance curve using Displacement as X variable and Pressure as Y variable via HISTORY -> SINGLE VARIABLE PLOTS.
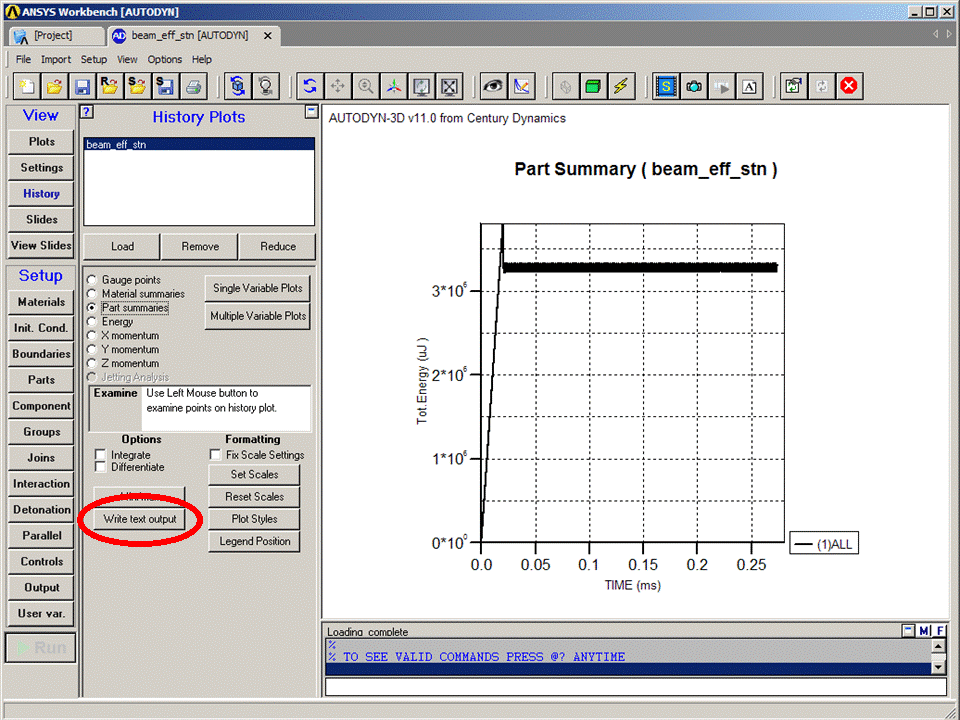
You can output the time history of variables at gauge points, or part summary, or material summary to a text file as instructed in the following picture. Then open the text output in a spreadsheet such as MS EXCEL. You can then use EXCEL to further post-process the time history results.
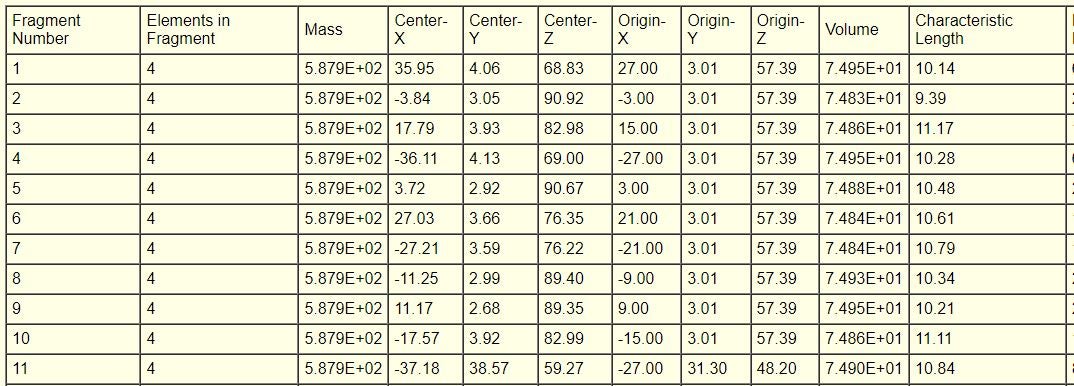
Characteristic Length indicated the geometric dimension of fragments.