Hello,
Currently, I am facing an issue with the current density plot for my 3D simulation model. Description of the problem is as follows:
Case I:
Simulation of single slot geometry is carried out with the boundary conditions as shown in following figure:
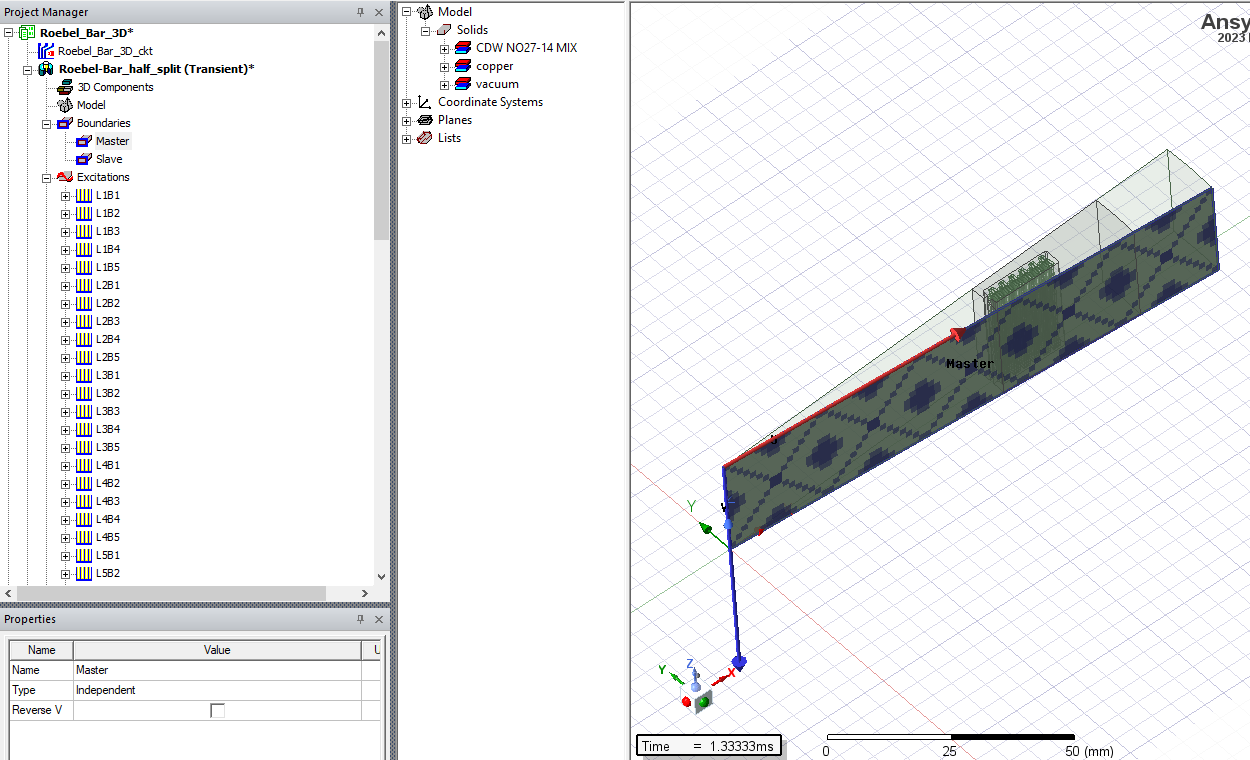
Where, opposite face is with Hdep = -Hind
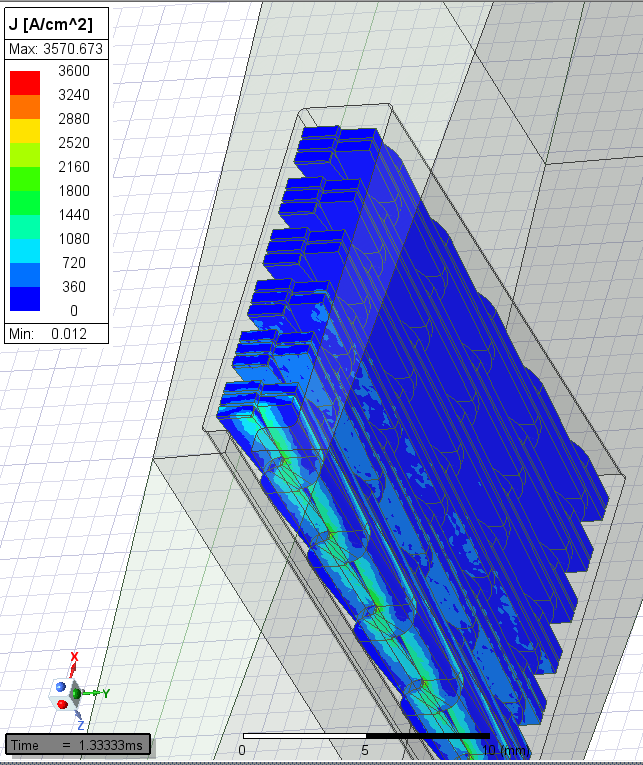
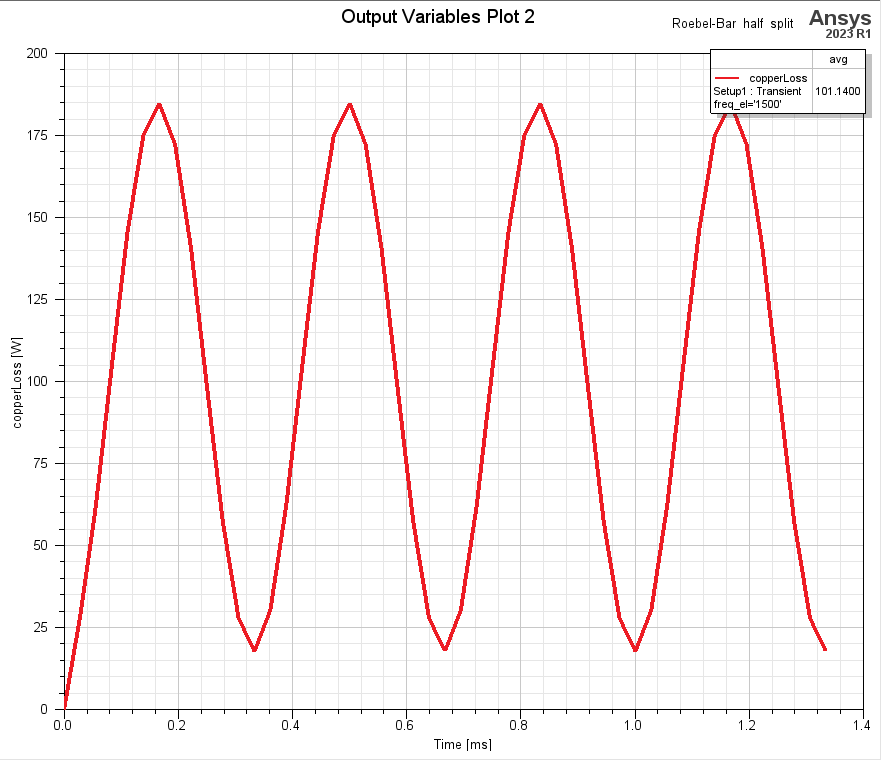
following figures shows current density plot at 1.3 ms at 1500Hz frequency and SolidLoss respectively (avg = 101.14 W)
Case II:
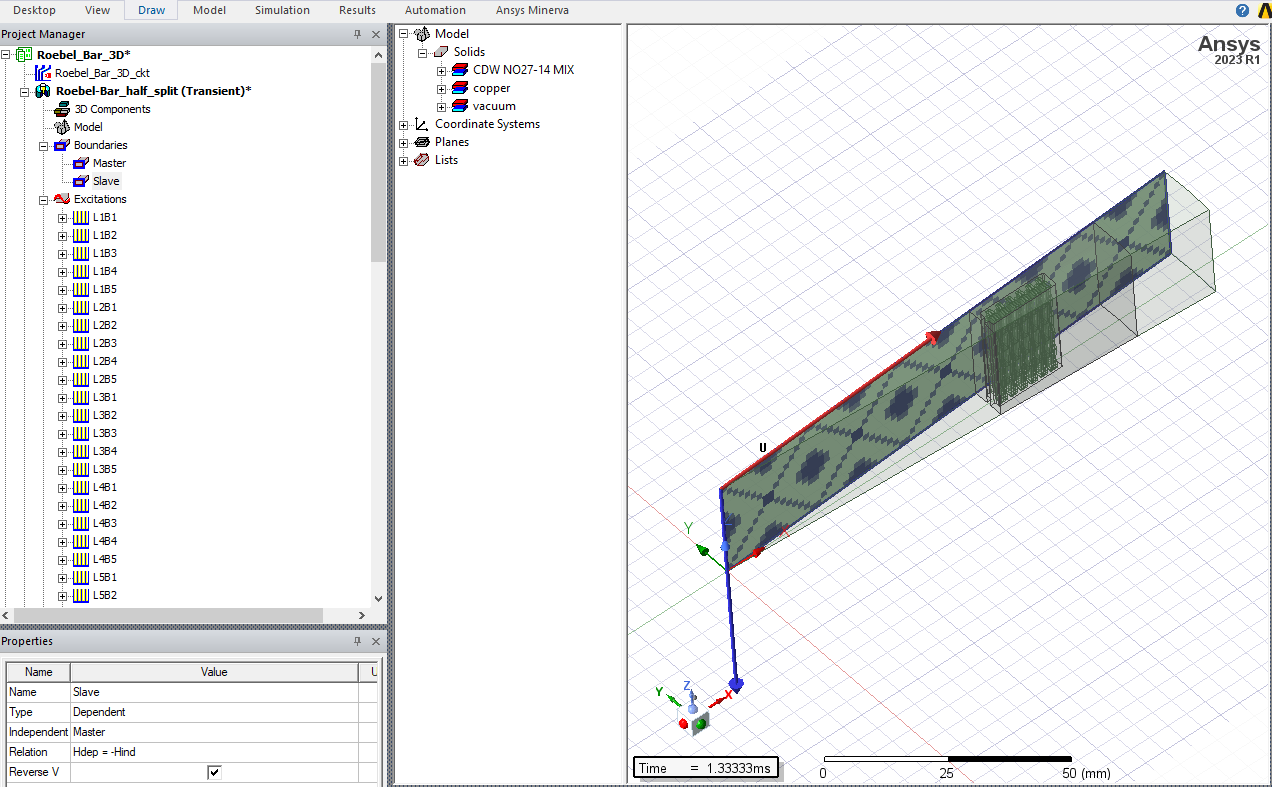
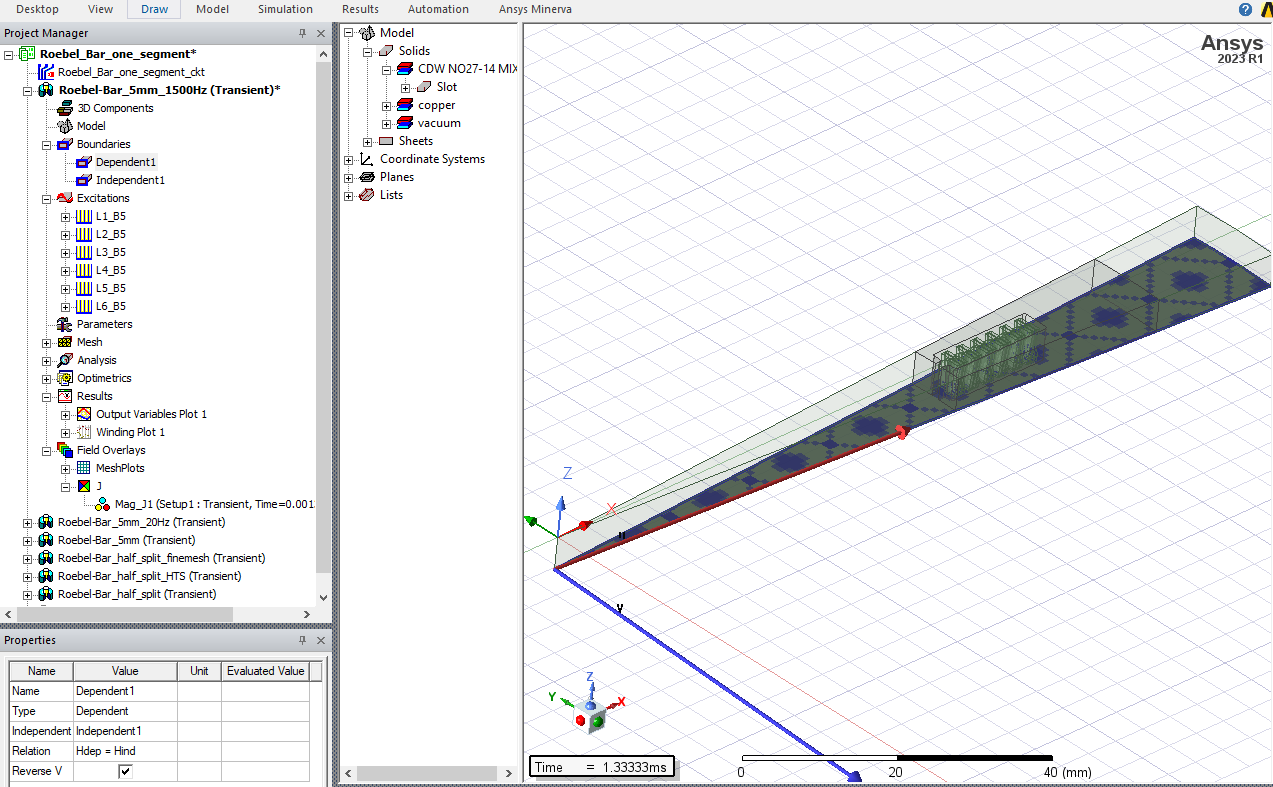
However to reduce the size and simulation time of the model symmetric boundary conditions are used as follows:
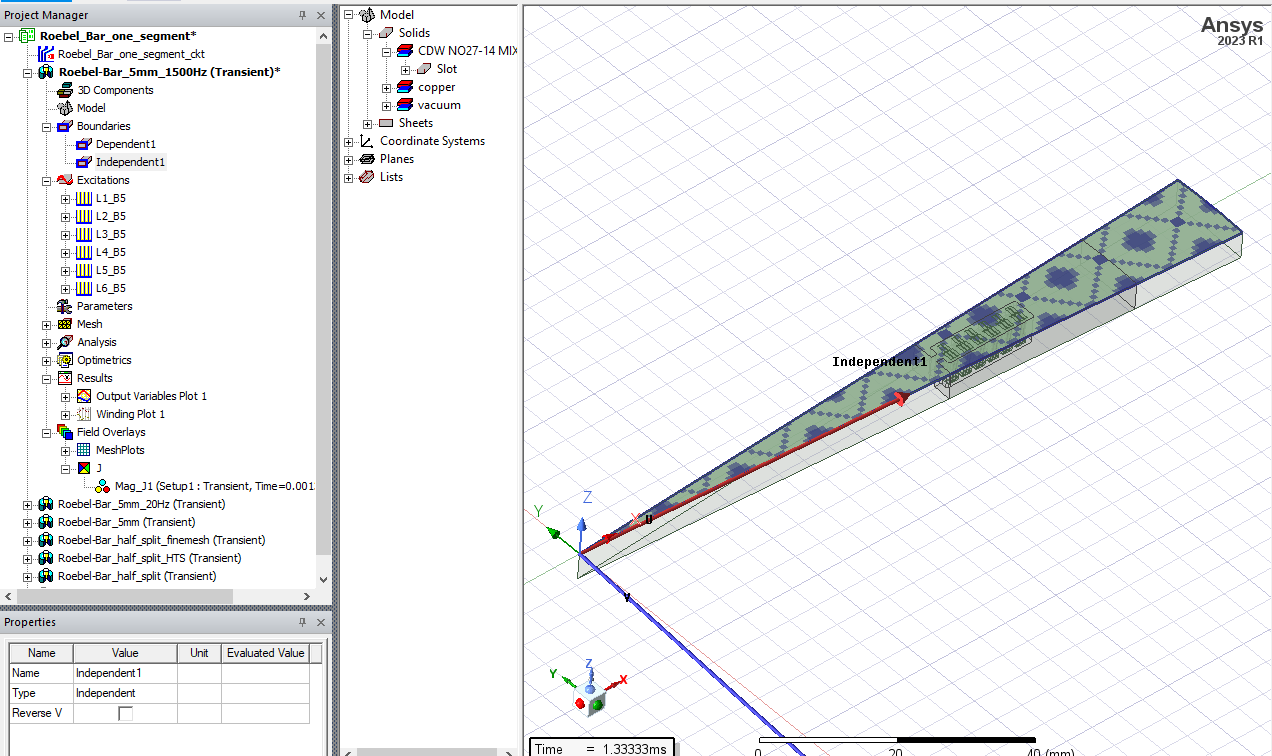
Where, opposite face is with Hdep = Hind
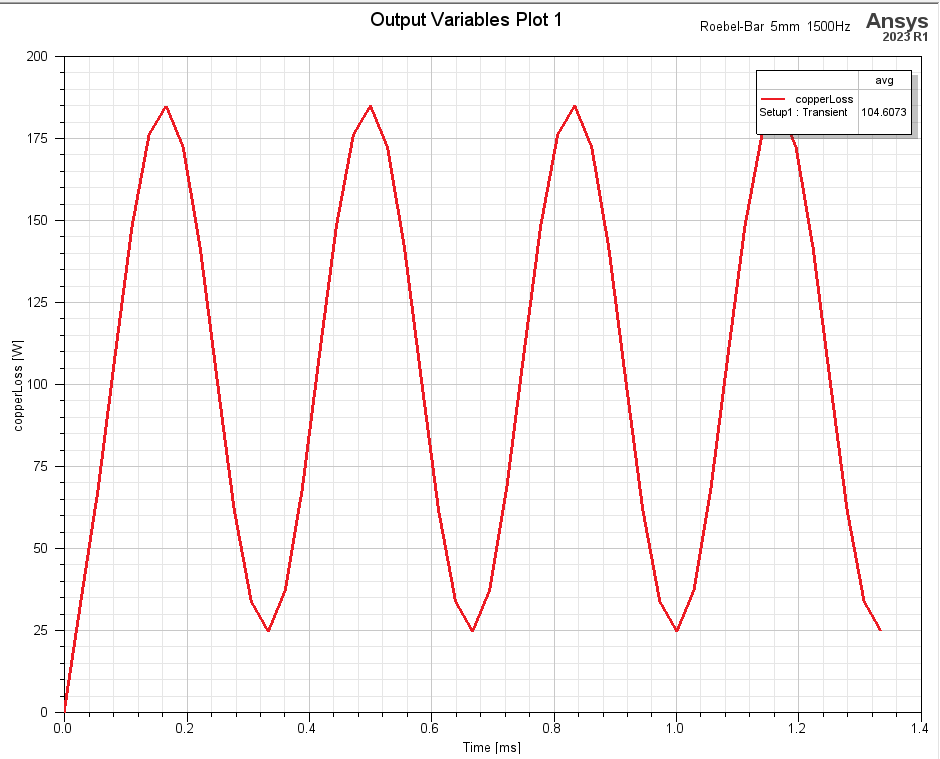
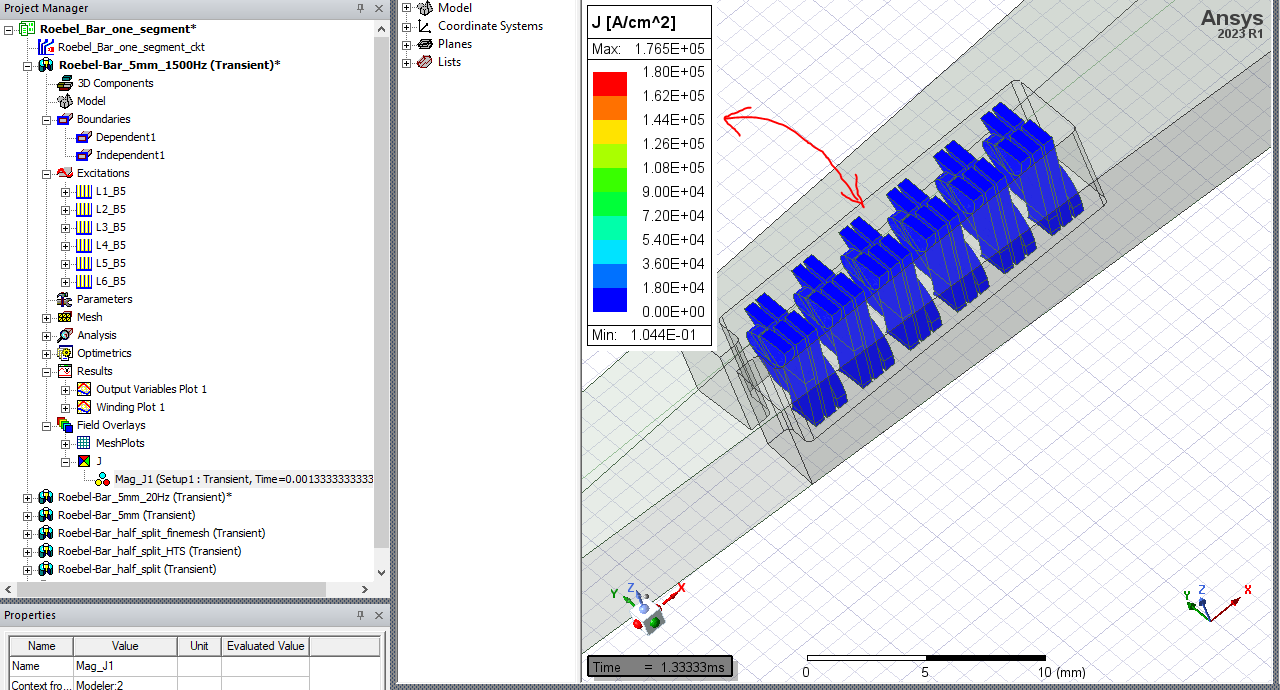
with these boundary conditions and at same operating point SolidLoss was found to be same with the use of proper multiplication factor since the active length of the geometry is reduced. (104.61 W). However, when it comes to current density plot it does not match with case I


















 You are navigating away from the AIS Discovery experience