-
-
October 25, 2023 at 12:26 am
Nate K.
SubscriberHello Forum,
I am trying to model a vertical axis wind turbine in Fluent but keep getting this message when I "check case": Review wall motion. Stationary wall motion relative to adjacent cell zone detected.
Even if I try all options of boundary conditions (walls moving, stationary, etc), I am still given the above message.Can anyone help? Would greatly appreciate it if so.
Btw, I have tried to attach my project file for viewing but it seems the file type (.wbpj) is not accepted for attaching... perhaps there another way to share files for help?
Thanks,
Nate -
October 25, 2023 at 8:56 am
Rob
Forum ModeratorThe wbpj file is the Workbench index/control file - it's useless without the rest of the files! If you do transfer use the File>Archive to create a wbpz as that has (nearly) everything in it. However..... Staff aren't permitted to download anything as one of the legal department conditions on us answering questions: it's to avoid complications with US Export Law.
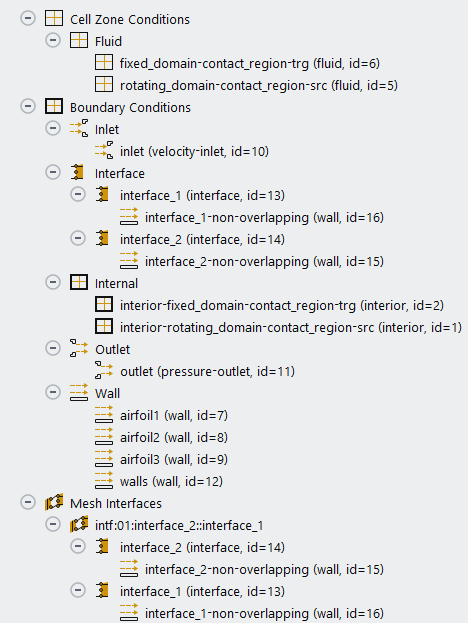
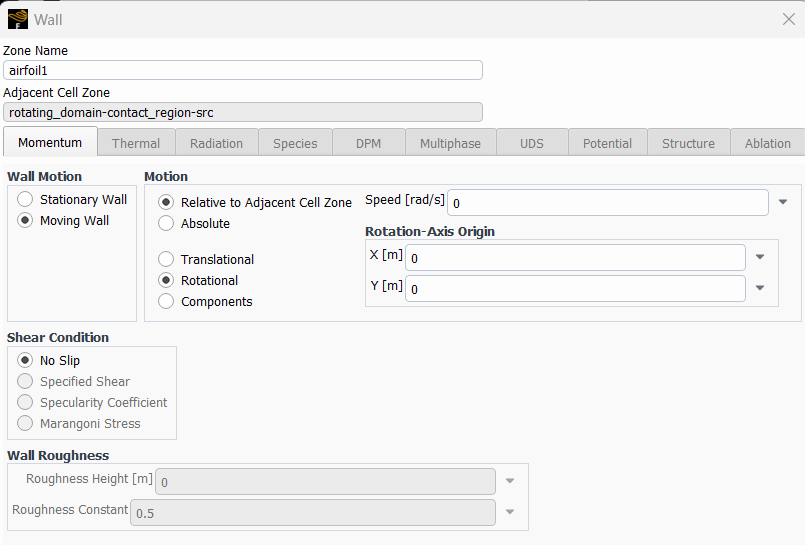
On the actual problem. Are you using Frame Motion or Mesh Motion? Then check the walls within the rotating zone are set as moving, rotating and at zero relative velocity. Posting some pictures might help, along with a screen grab showing the boundary condition list (use the group option to show walls, inlets etc).
Have you reviewed the two VAWT lectures in Learning (on here)?
-
October 26, 2023 at 1:09 am
Nate K.
Subscriber... oh, and to reply to your last question, yes, I have completed the two VAWT tutorials on Ansys Innovation Space. By the way, kindly check out my reply to my post above (I answered the rest of your questions and added pics) as I may have just replied to the post and not to you directly... not sure if it matters, but wanted to let you know just in case it does.
Thanks,
Nate
-
-
October 25, 2023 at 6:47 pm
Nate K.
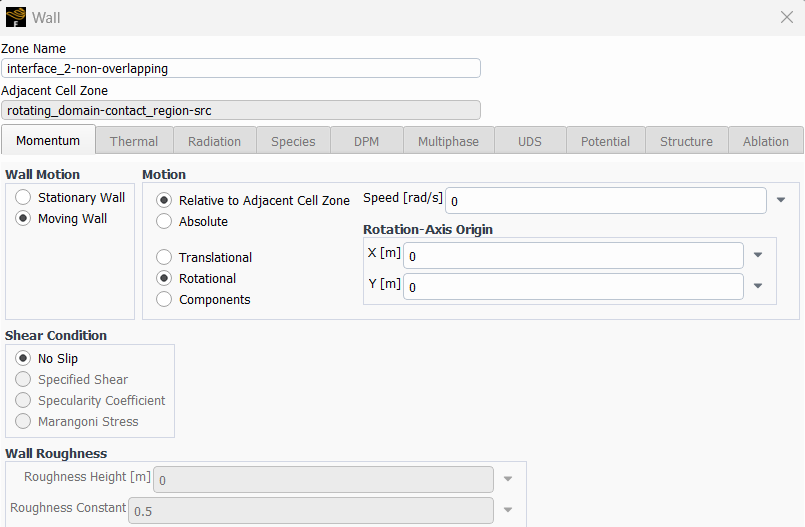
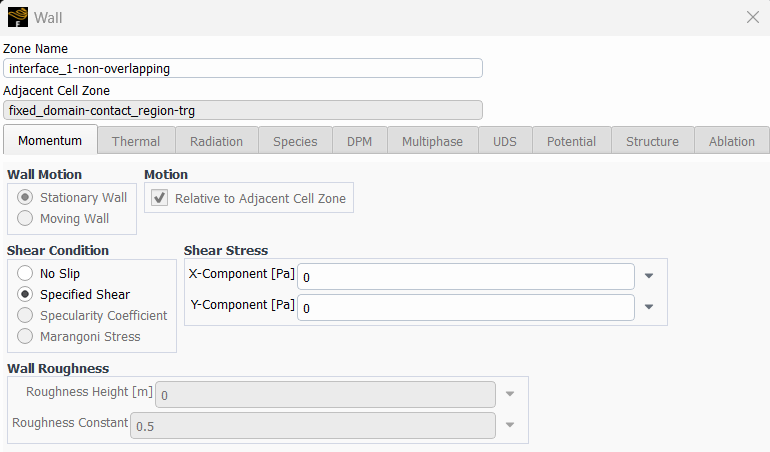
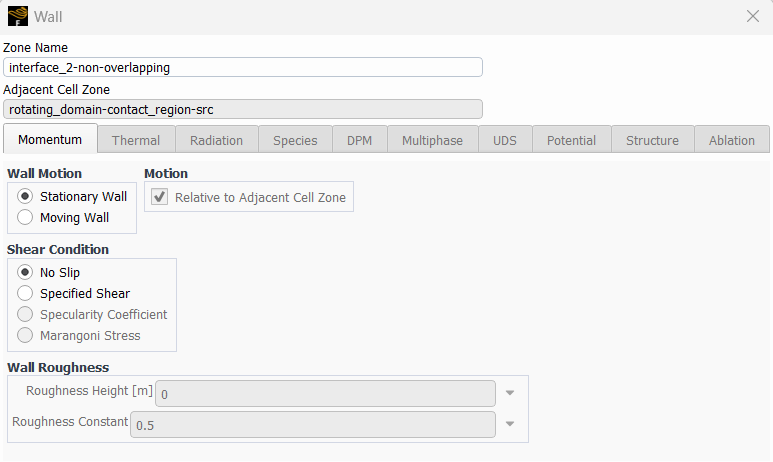
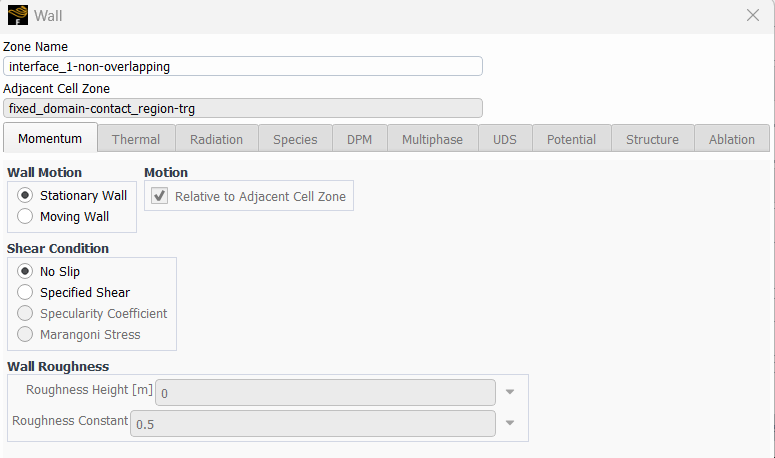
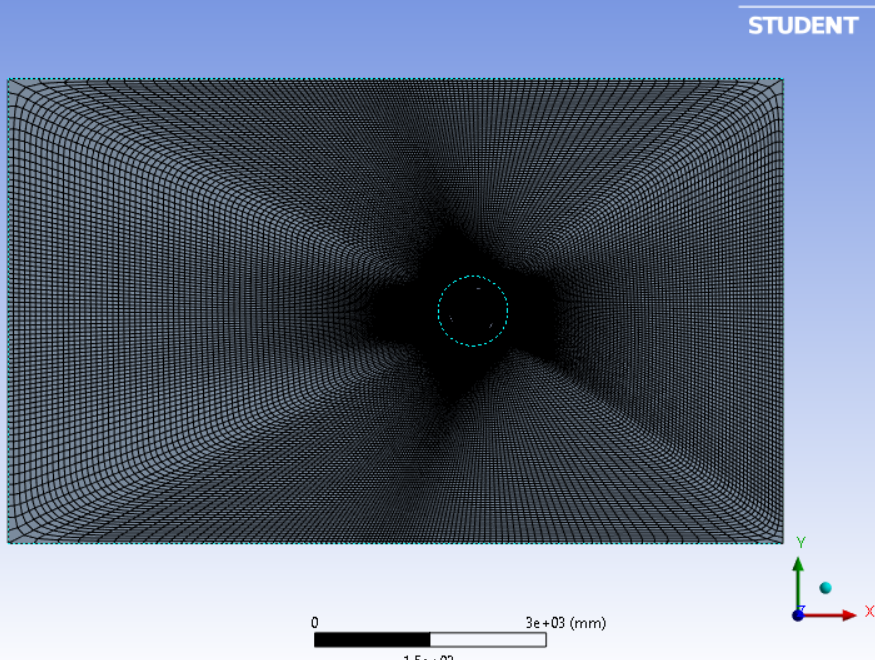
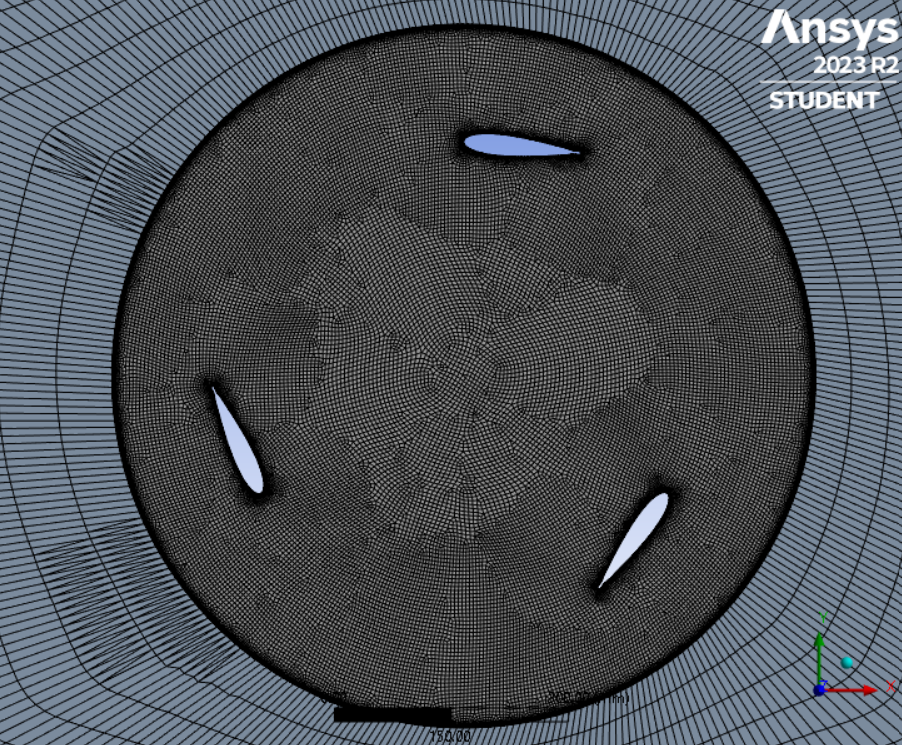
SubscriberHi Rob,That seems very strange that Ansys has it set up so that employees cannot help by looking at a students software directly (I can't help but wonder if export law is really the reason? No way around this?). Hopefully just pics and info will suffice.I am using mesh motion. I have checked the walls within the rotating zone that they are set as moving, rotating, and at zero relative velocity. For the outer two walls of the flow domain / fixed body, I have no the conditions set as zero shear.I have attached pics showing the boundary conditions list (and cell zone conditions and mesh interfaces), boundary conditions for the airfoils (one pic but all three are set the same), boundary conditions for the fixed domain walls, and also two pics showing the mesh conditions of the fixed domain and the rotating domain ... perhaps tying into this issue is the mesh conditions? If you can check those to in the pics, I would appreciate it... I have set them to match the boundary conditions... not sure if this is correct.Thanks,Nate -
October 25, 2023 at 6:50 pm
Nate K.
Subscriber....also, by any chance, do you know how I can change the time in my Ansys profile / account? The posts / replies I make here are way off... last reply is apparently posted at 6:47pm but I posted it at 11:47am my time.
Thanks,
Nate -
October 26, 2023 at 10:24 am
Rob
Forum ModeratorAh, don't set anything on the non-overlapping walls. They're for when the interface faces don't line up. With a VAWT you should have a single face on either side of the rotor-stator zones.
The file download is one of the conditions set to ensure we can't answer model specific questions on the public forum. Because Ansys software is technically dual use (US definition for Export Law) I need to be careful as my knowledge counts as an export - we've had to have training on this!
-
October 26, 2023 at 5:42 pm
-
October 26, 2023 at 5:53 pm
Nate K.
Subscriber...and surely being an expert, or not, regarding giving advice for student use of student software should not impose on the Export law. Afterall, student software is not for monetary gain but is strictly for academic use. Just saying :-) Perhaps you can bring this up to managers as far as something to look at.
-
-
October 26, 2023 at 10:27 am
Rob
Forum ModeratorTime may be something you can set in your profile (top right of the screen). Mine looks to be GMT so could either be a fixed server time or the usual confusion over GMT/BST/CET as I'm in the UK.
-
October 27, 2023 at 4:04 pm
Nate K.
SubscriberThe time issue of incorrect time has to do with the time stamp on each of my own posts in all posts. And clicking on any and everything in the top right of my page does not take me to anywhere (including profile to make time adjustments). How can I access my profile or wherever it is to make time adjustment? If you don't know can you kindly pass my post on to someone who might?
Thanks,
Nate
-
-
October 27, 2023 at 9:00 am
Rob
Forum ModeratorThat's a warning rather than an error. In theory, you have a few airfoils, and walls at the domain extents (or pressure bcs), please can you post some images.
-
October 27, 2023 at 7:10 pm
Nate K.
SubscriberI have been following someone else who shared a video of the project I am working on... in this main project I am following, there was no such warning given... for whatever that's worth. And what pictures exactly can I send you that would help?
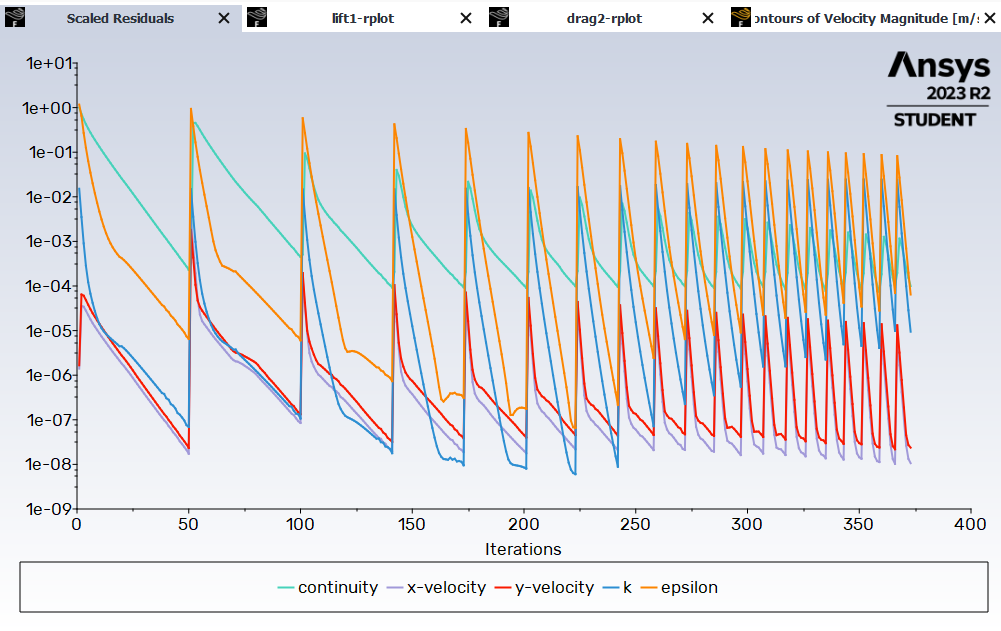
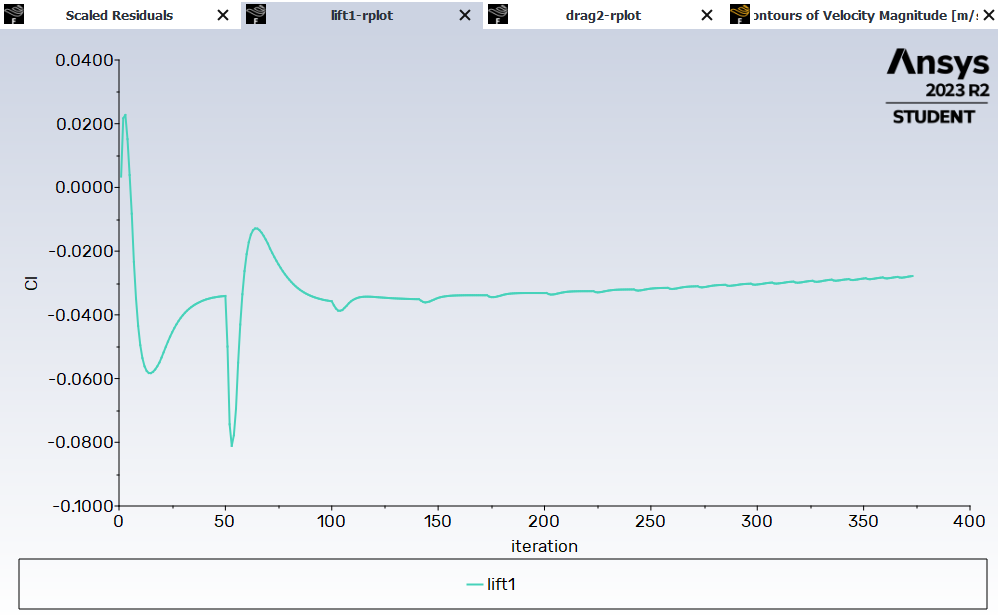
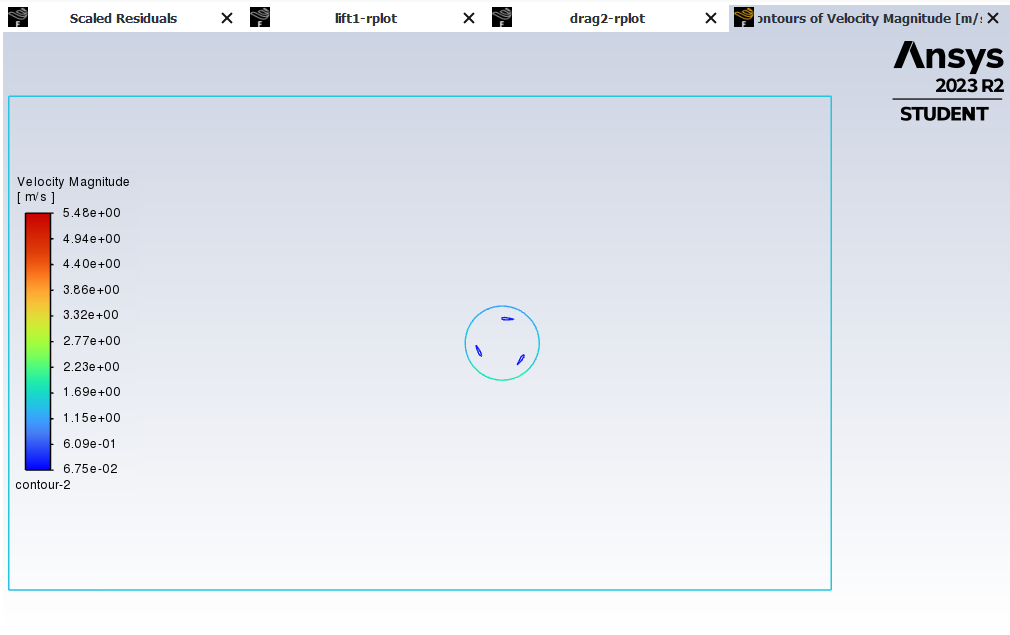
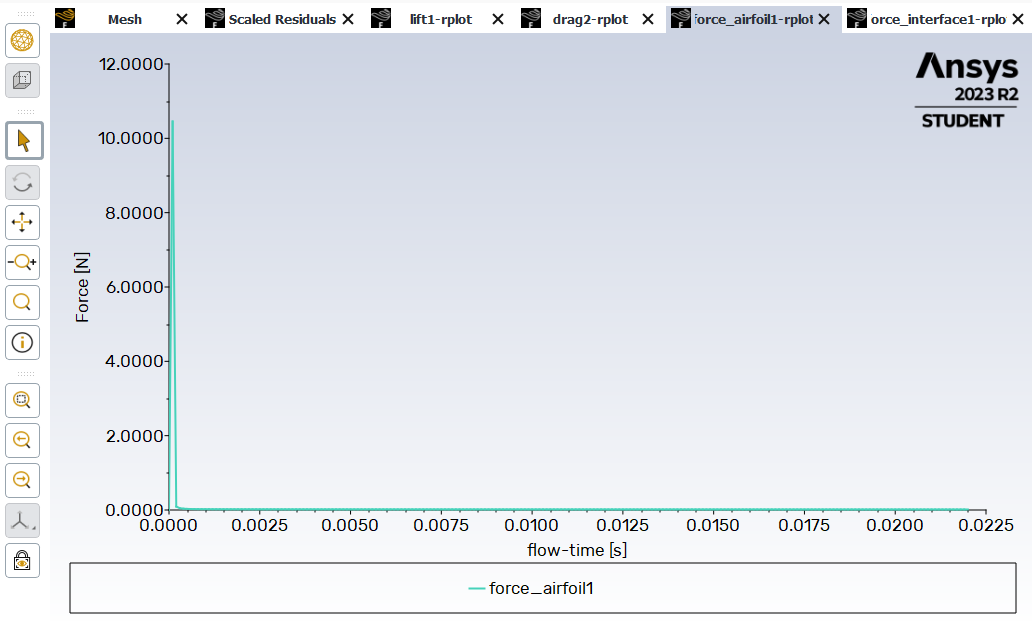
By maybe this will help. The main reason for me to try and get rid of that wall BCS warning is that when I run the calculation my results look nothing like what I expect. The residuals plot seem fine (as far as I can tell being a newbie), but the drag coeffecient plot starts out with a curve then abruptly goes down in value and remains low. The video from the main project that I followed shows a straight line drag co plot. Also, my lift plot seems to be incorrect... it cycles a little and then sort of flatlines. And both my velocity and pressure contours show nothing but only a velocity and pressure exactly on the walls or sketched lines. I'll attach pics.
Hopefully that helps :-)
-Nate -
October 30, 2023 at 6:39 pm
Nate K.
SubscriberHi Rob,
It is currently 11:39am my time and 6:39pm your time Monday the 30th. It is now after business hours your time, and I see I have not received a reply from you today regarding my last two most recent replies to you in the above post made last Friday. Can you kindly look at those two replies (especially the one on the Fluent issue) and share any advice? I would greatly appreciate it.
I hope I am not being bothersome. Being you and I are on two different parts of the world, it means we can each respond only once per day... so, it makes for very slow solving of issues. And if a day is missed it is doubly felt. Your help solving the Fluent issue would be greatly appreciated.
Thanks,
Nate
-
-
October 31, 2023 at 2:05 pm
Rob
Forum ModeratorI also have days off!
If you plot without selecting any faces in Fluent (2d) I'll see the contour of what's going on. The above looks to be plotted on the walls?
Monitors typically spike in the early stages as the initial condition works through the domain. It's normal practice to work out a domain residence time and ignore data taken before a few cycles or residence times (time for flow to get from inlet to outlet).
Note, the coefficients rely on area values so you may find they don't report what you expect. You may find force components or moments to be a more useful output.
-
November 1, 2023 at 2:33 am
Nate K.
SubscriberI am glad you do! :-) And hey, does this mean you, perhaps, work Tuesday - Saturday? Or just an extra day off? Just wondering!
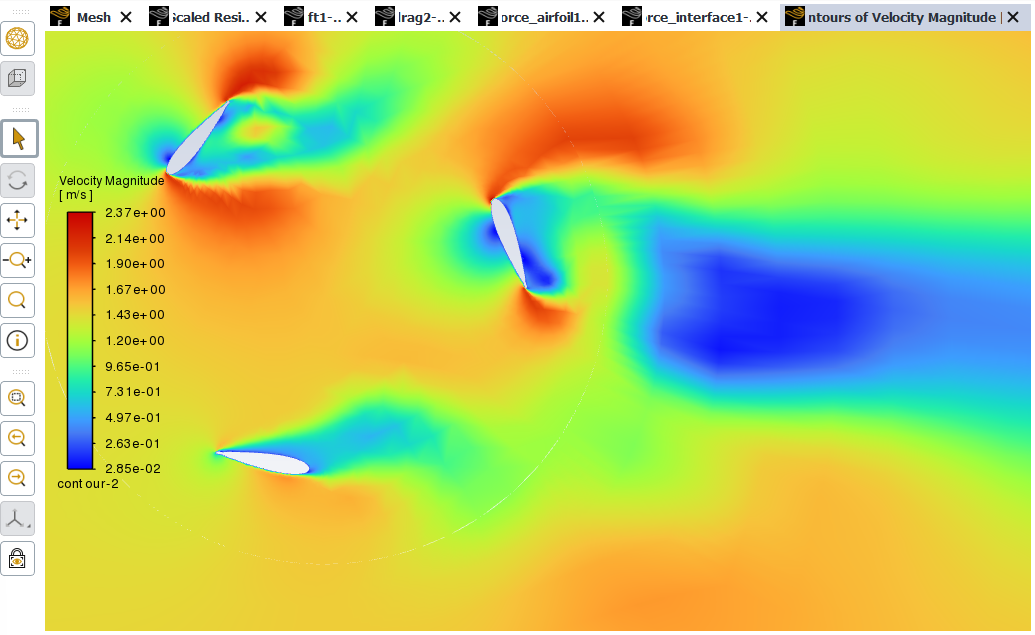
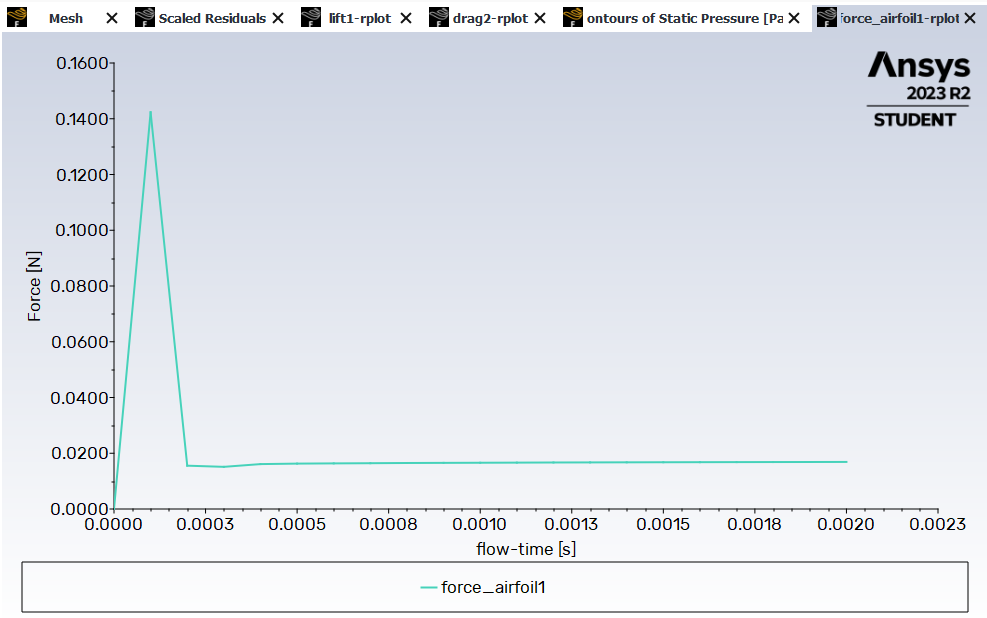
I have removed the walls for the contours and have pics of the pressure and velocity... definitely something not right here. Also, I have added a force plot of the airfoil #1, but this plot matches the drag plot I sent earlier (makes sense)... or are you thinking to not force plot an airfoil but perhaps the whole rotating domain? If so, how would I do this? I do not see an option to choose the rotating domain... only airfoils and interfaces (which did not plot anything). Perhaps changing the force plot won't matter cause looking at the drag and or force plots, it seems they should be cyclical... so repeating... but they only show one increase and then decrease and then it flatlines... perhaps my model isnt rotating? How could I check? Or is this a sufficient way to know?
Any other ideas?
Thanks
Nate
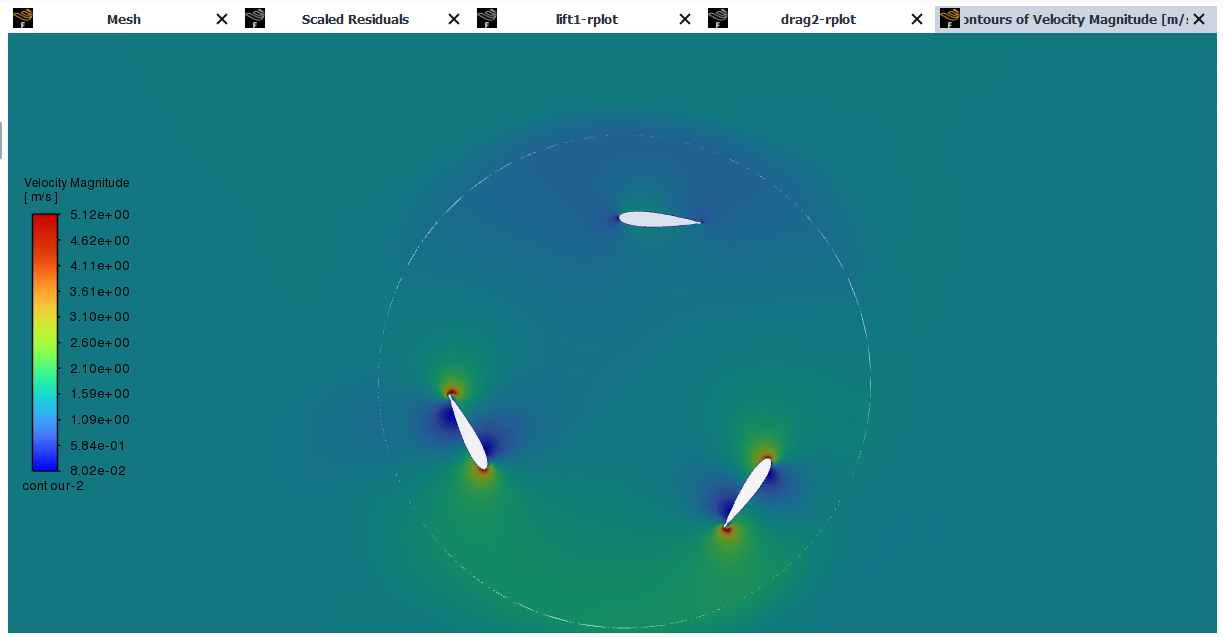
-
-
November 1, 2023 at 10:23 am
Rob
Forum ModeratorI've not taken enough holiday so 4 day weeks now until January :)
You've run for 0.002s - you may need to run for a bit longer for the flow to evolve!
-
November 1, 2023 at 3:48 pm
Nate K.
Subscriber...but isn't the rise and peak and decline portion of the force and drag plots directly reflect the effects of one whole rotation of airfoil 1? If so, then in that same plot I should see a repeat of this up, peak, and down, right? Instead there is a flat line which runs for ~10 times the length of the rise, peak, and back down portion...
-
November 1, 2023 at 3:57 pm
-
-
November 1, 2023 at 3:57 pm
Rob
Forum ModeratorYou will see an oscillation, but is it really spinning at 30,000 rpm?
Edit - 300,000rpm? (1/0.0002)*60
-
November 1, 2023 at 4:01 pm
Nate K.
SubscriberBut is not the rise, peak, and decline an indicator of a full rotation of the airfoil? If so, then the roation speed doesn't matter, as the rise, peak, and decline should repeat and not flatline for such a time after as is seen in the pics...
-
November 1, 2023 at 4:09 pm
Nate K.
Subscriber...I am testing it now with a much lesser time step and much greater duration... I see another rise happening (phew!).. gunna take a while to compute.. will post results later...
-
November 1, 2023 at 4:47 pm
Nate K.
Subscriber...since my last message saying I was running the simulation again and saw a 2nd peak I changed max number of iterations per times step from 20 to 5 and reran it... not sure why but that second larger peak did not show... however, there are a few subtle rises and lowerings.. but definitely nothing clearly cyclical is present... see pic below. Also the velocity and pressure contours seems much better, right?...
Any thoughts?
-
-
November 1, 2023 at 5:21 pm
Rob
Forum ModeratorRemember you're going to be looking at wake interactions so you may need a few cycles to see a pattern. You may also want to review the y-axis scale to eliminate the initial spike.
-
November 1, 2023 at 10:24 pm
Nate K.
SubscriberIndeed. However, I imagine my most recent force plot is not correct. Kindly take a look at it and let me know what you think... it is 10 seconds long and does not show any signs of cyclic behavior. It is quite random.
-
November 1, 2023 at 10:26 pm
Nate K.
Subscriber...in other words, shouldn't a wind turbine in steady wind conditions produce a cyclical force plot of ups and downs in magnitude as the turbine spins? I assume so. If so, do you think it is a settings issue for my Fluent case and what could I change to help this?
Thanks,
Nate
-
-
November 2, 2023 at 12:34 pm
Rob
Forum ModeratorVelocity is 2m/s so what is the unit diameter and rotation speed? 10s could be enough, but may not be.
If you look at the graph, there's a cycle at around 4s period, but you've only really seen two. That could be due to the wake interaction or just that you need more cycles. It's possible you have a rotation cycle effect and a wake effect such that the combined cycle isn't obvious.
-
November 2, 2023 at 12:35 pm
Rob
Forum ModeratorDid you use the automatic sliding interface creation in Fluent? How well does the mesh capture each side of it?
-
November 2, 2023 at 8:02 pm
Nate K.
SubscriberHi Rob,
I don't belive I used the automatic sliding interface creation in Fluent... I simply created an interface under "Boundary Conditions" and then "Mesh Interfaces"... or is this the automatic creation you mentioned?
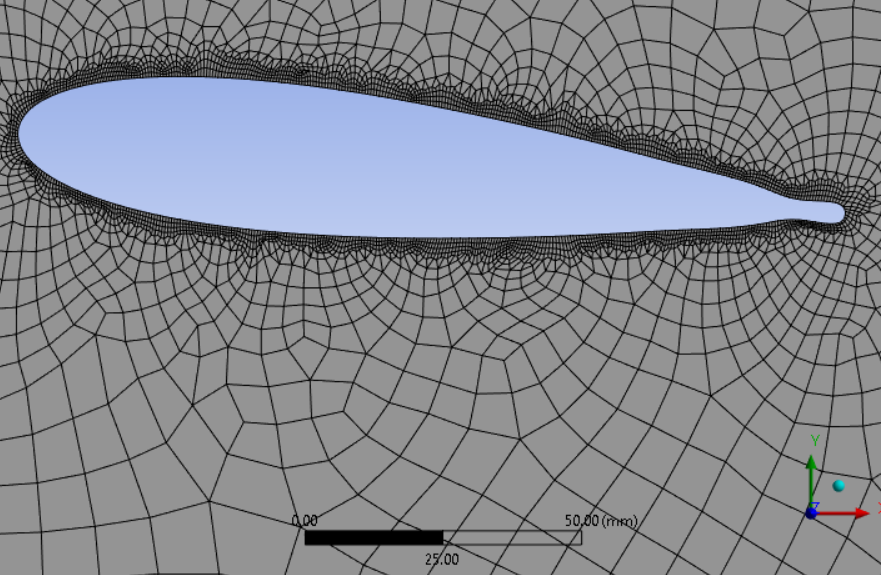
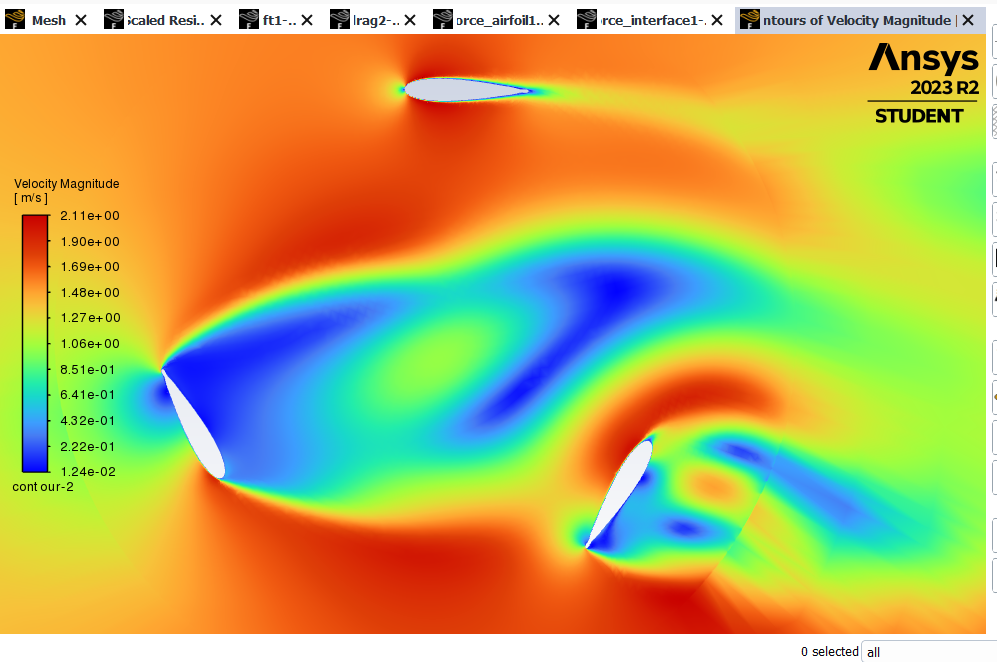
I have added more meshing and refined it (new meshing in shown in the pics, below) and increased the max number of iterations per time step to 20, changed the time step to 0.05s, and overall time for around 18 seconds. The incoming wind is at 1.48 seconds (so slightly less revolutions per second than before).
The force plot looks good as far as it having matching values with each cycle. However, I am not sure why there is a dip right at 5.0 seconds and again right near 12.8 seconds. Seems to be two cyclic patterns happening here? Any thoughts? Is this as good as it gets? I imagine the cyclic behavior to be better but am not sure...
I'll attach the velocity contours, too.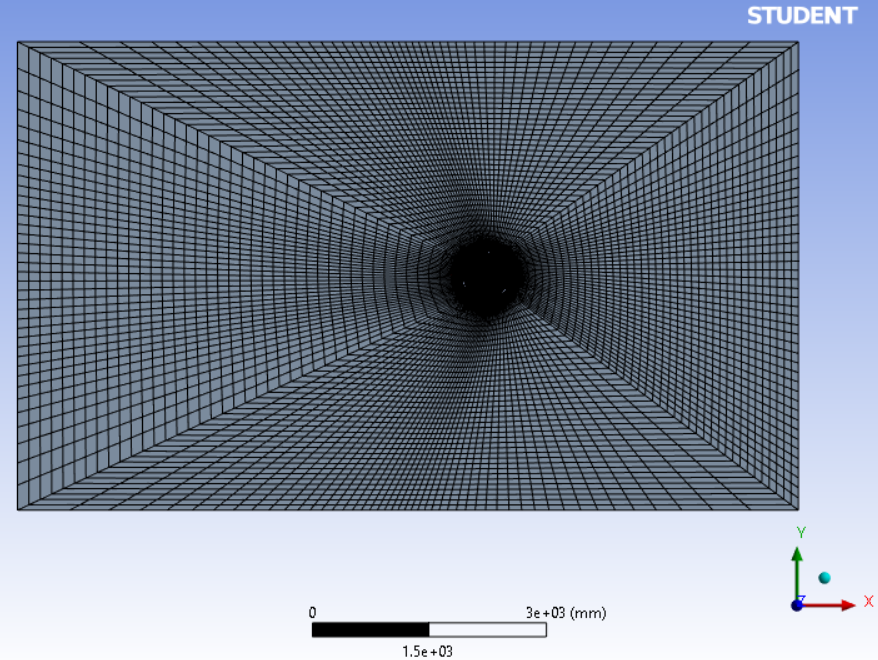
-
-
November 3, 2023 at 12:07 pm
Rob
Forum ModeratorRight, the contour looks about right given the mesh. Unfortunately the mesh needs re-doing. Aim for (roughly) the same cell size on both sides of the interface. Also, I'm not sure how you meshed around the blades, but you really want a smoother change in size that close to aerofoils. Assuming you used a lot of sizing settings, use fewer and rely on the size functions. Also look at setting surface mesh type to not be mapped.
-
November 3, 2023 at 5:50 pm
Nate K.
SubscriberAlright, thanks.
How do I add mesh on the outer side of the interface? When I try to add edging mesh it only applies to the inner side. Is there a way to add it just to the interface edge (so instead of making more fine all the mesh on the whole surface)?
Also, how can I create the finer mesh around the airfoils to be extended outward more to smooth the transistion better? Whenever I change the edge meshing here it only applies to the area which is already fine meshed... it doesnt extend further outward.
-
-
November 3, 2023 at 10:29 pm
Nate K.
SubscriberI have decresed the size of the mesh over all areas, but the calculations are similar to before. See pics, below. I was not able to add meshing specifically on the interface going outwards (inflation did not work here)... Oh, I see I still have the mapping on but I do not imagine that will change much, right?
Looking at the force plot I imagine the issue it something besides meshing, as the plot looks clean, cyclical (if the mesh was off the results would show randomness, right?). It simply has a dip added at each cycle... or, perhaps, a second cycle happening simultaneously.. hmmm.. must be a setting incorrect somewhere or perhaps the Fluent setup? Or? Hmm... -
November 7, 2023 at 3:07 pm
Rob
Forum ModeratorThe easiest way to fix your mesh will be to put a "box" around the region near the rotating zone. Then set a size there that's similar to the rotating region. Because the mesher is trying to map the outer region it's stretching the cells too much. Alternatively, if you can force a pave mesh (surface mesh type) it should behave better.
-
November 7, 2023 at 4:59 pm
Nate K.
SubscriberBut do you really think the "double" cyclic behavior -- dips as previously mentioned -- is really manifested due to the mesh? I ask becuase the video / tutorial I followed had similar mesh to what I have and its results did not have the same behavior. My force plot seems clean and repetitive meaning there seems to be no random type error that I would think would manifest due to mesh not being adequate. Also, what is your reasoning that the mesh is not adequate?
Thanks,
Nate
-
-
November 8, 2023 at 9:00 am
Rob
Forum ModeratorThe mesh may be a factor, and it's always a good idea to fix it as no one will trust results from a poor mesh. It's also "easy" to mark down on a report!
If the cycle is repeating like that then you need to compare the frequency with that of the blade rotation and interaction. I don't know if you're monitoring a single blade, but if the wake hits the downstream blade I'd expect some response to be seen.
What I would suggest is running another cycle but save contour plots (or an animation) to compare the xy data with flow results. Trying to draw a conclusion from snapshots and a monitor is risky, so I'd always create more data than I need to then work out what to use.
-
November 8, 2023 at 5:30 pm
Nate K.
SubscriberThanks. I appreciate it.
I have to move on to another Fluent project so this one will get the back burner. I hope to be able to look into this current project a bit down the road… will try what you last mentioned... and I'll apply it to my next project as well.
Thanks again for the help so far.
-Nate
-
-
- The topic ‘Looking For Help – Boundary Conditions’ is closed to new replies.


-
2979
-
970
-
857
-
750
-
599

© 2025 Copyright ANSYS, Inc. All rights reserved.

