TAGGED: cfd-post, fluent-post-processing, plots, post-processing, xy-plot
-
-
July 16, 2021 at 1:21 pm
Raj007
SubscriberHello all,
I would like to plot Temp vs Time in Steady-state analysis on preferred locations like line, point, and so on. Please suggest to me how to do it.
Thank you
July 16, 2021 at 2:36 pmRob
Forum ModeratorWhat is changing in time in a steady state analysis?
July 16, 2021 at 2:50 pmRaj007
SubscriberI have a developed flow where temperature changed with the speed of flow. I want to know how the temperature is changing.
July 16, 2021 at 3:06 pmAmine Ben Hadj Ali
Ansys EmployeeCreate a pathline and color it by temperature and display it as XY Pathline or particle track
July 20, 2021 at 11:51 amRaj007
SubscriberDo you mean just a line like Post Processing/Location (Creation tools)/ Line?
July 20, 2021 at 12:20 pmAmine Ben Hadj Ali
Ansys EmployeeYes: you create the pathline and you color it by whatever. You do that in the pathlines panel.
July 20, 2021 at 12:57 pmJuly 21, 2021 at 6:32 amAmine Ben Hadj Ali
Ansys EmployeeI am talking about Post Processing In Fluent.
July 25, 2021 at 9:26 pmRaj007
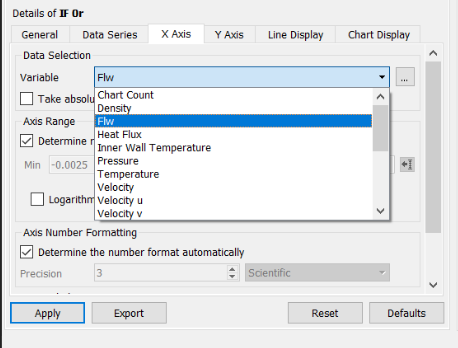
SubscriberIt is from Post-processing
Viewing 8 reply threads- The topic ‘How to plot Tempersture vs Time in steady state analysis in Fluent Post’ is closed to new replies.
Innovation SpaceTrending discussionsTop Contributors-
4793
-
1571
-
1386
-
1242
-
1021
Top Rated Tags© 2026 Copyright ANSYS, Inc. All rights reserved.
Ansys does not support the usage of unauthorized Ansys software. Please visit www.ansys.com to obtain an official distribution.
-


