-
-
February 18, 2022 at 8:31 am
prasadmsonar
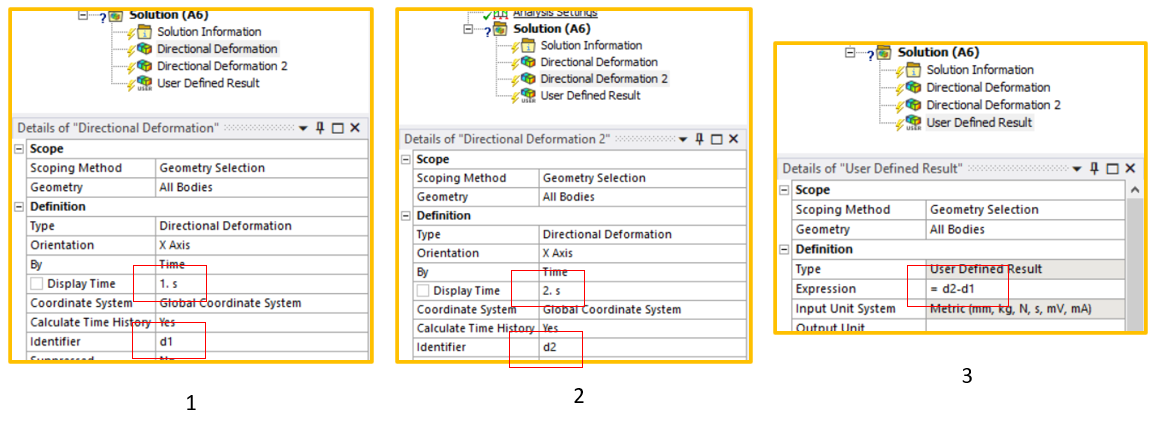
SubscriberI need to know sliding distance difference in step 1(press fit) and step 2( press fit+load). How to plot this?
February 18, 2022 at 5:50 pmAshish Khemka
Forum Moderator
You can use the user-defined result to define an expression that represents the difference between relevant results with each result item represented by an identifier. For example is the result item of interest is directional deformation in x-direction then following can be implemented:
 Regards
Ashish Khemka
Viewing 1 reply thread- The topic ‘how to plot result using 2 result combination? for example sliding at step1 – sliding at step 2’ is closed to new replies.
Ansys Innovation SpaceTrending discussions- Problem with access to session files
- Ayuda con Error: “Unable to access the source: EngineeringData”
- At least one body has been found to have only 1 element in at least 2 directions
- Error when opening saved Workbench project
- Geometric stiffness matrix for solid elements
- How to apply Compression-only Support?
- How to select the interface delamination surface of a laminate?
- Timestep range set for animation export
- Image to file in Mechanical is bugged and does not show text
- SMART crack under fatigue conditions, different crack sizes can’t growth
Top Contributors-
1241
-
543
-
523
-
225
-
209
Top Rated Tags© 2024 Copyright ANSYS, Inc. All rights reserved.
Ansys does not support the usage of unauthorized Ansys software. Please visit www.ansys.com to obtain an official distribution.
-


