TAGGED: EME
-
-
December 27, 2022 at 5:04 pm
Vahram Voskerchyan
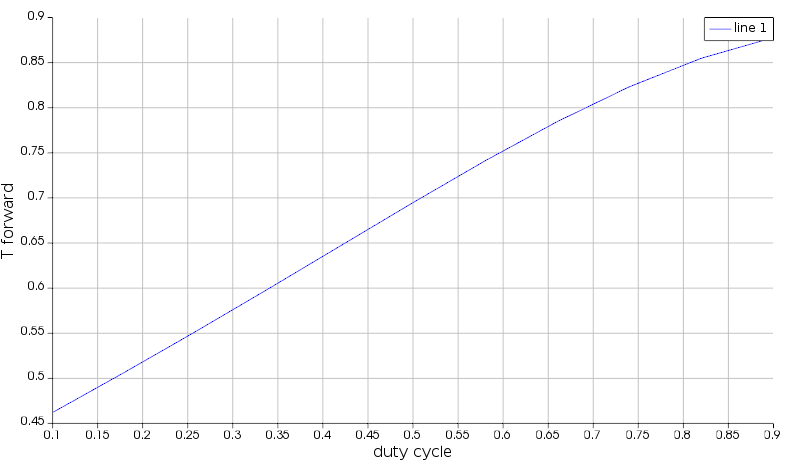
SubscriberI am trying to calculate how the duty cycle of the grating affects the reflection and transmission profiles. And I am getting wrong results. The attached code is the EME setup, please help me to identify what is wrong with the simulation. I am trying to sweep the duty cycle of the grating for 1000 periods and plot the transmission versus the duty cycle sweep. I have selected the conserve energy method and when doing so I can see that maximum peak is at 0.5 duty cycle. But when turning off the conserve energy I get a plot like this. I want to do make passive because I want to see at which length the transmission becomes 0.
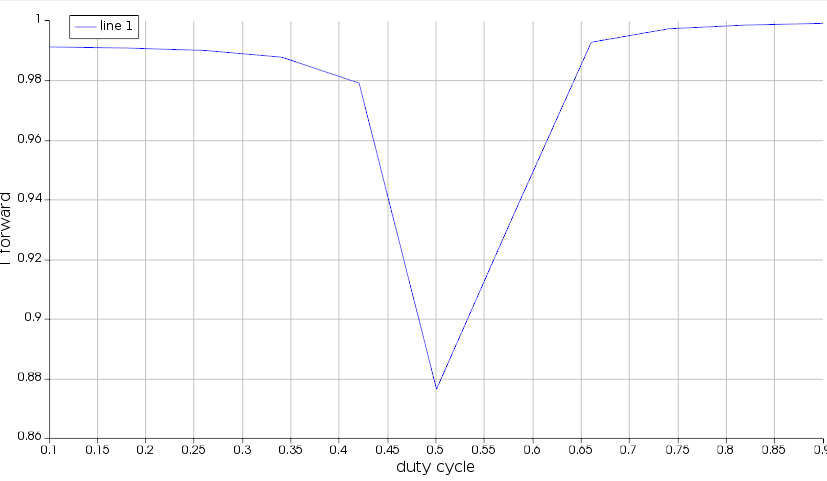
And when the conservation of energy is setup the plot is as follows.
I was expecting to see a similar plot with the "make passive" option on.
I have tried mode convergence sweep to see where the profile gets stable, I tried different meshings, and setting up cells differently. But the results are still confusing. Can you please help me to identify the problem ?
I have also attached the script. In the link below.
https://drive.google.com/file/d/1nw1Xm7zujpmfgltg5U1xedLuITUyBC3T/view?usp=sharing
-
December 27, 2022 at 8:21 pm
Guilin Sun
Ansys EmployeeUnfortunatelt we are not allowed to download any customer files from this forum.
For periodic simulation, please use "conserve energy". This is because, any minor change in S can result in huge difference when many periods are used. as you can see, (S+ds)^N so when N is large the error will be amplified significantly.
On the other hand, the convergence testing can be challenge:
Understanding EME error diagnostics
Convergence Testing - Error Diagnostics - Method for Using Diagnostics
-
- The topic ‘Help to debug the EME simulation setup.’ is closed to new replies.


-
3442
-
1057
-
1051
-
917
-
896

© 2025 Copyright ANSYS, Inc. All rights reserved.


