-
-
January 11, 2018 at 9:31 pm
mami826
SubscriberHi All,
my aim is to find the thermal conductivity of litz wire and also convection coefficient of litz wire and air.
So, I am running experimental analysis (10A current into litz wire) and capturing the temperature of litz wire. So, I have temperature profile versus time for litz wire. Would you please help me how I can feed the results (temperature profile) into ansys maxwell (reverse engineering) to define unknown thermal conductivity or in thermal analysis convection coefficient?
Is it possible?
Â
Thanks RegardsÂ
-
February 9, 2018 at 4:47 pm
peteroznewman
SubscriberThis is possible. ANSYS has a Design Exploration toolbox that makes the process of searching for a thermal conductivity or convection coefficient to match experimental data easier.
While the electromagnetic field the wire generates may be its primary function, you are asking about a thermal problem, so this model may be built in a Transient Thermal or a Steady State Thermal model instead of Maxwell. A Fluent model may be appropriate to help calculate the convection coefficient.
If you want to get started on this, please reply with more details on the experimental setup for measuring the temperature profile of the wire.
-
February 12, 2018 at 8:37 pm
mami826
SubscriberThank you so much peteroznewman,
I would say I run the experimental test to measure the coil temperature using the thermal camera (please have a look at the pics-attached file). So, I have a temperature versus time profile from experimentation.
Moreover, I modeled coil in Maxwell and apply 20 AÂ and create coupling with transient.
But in transient, i have to apply convention coefficient as a temperature function.
As I said in my previous post, I would like to define convection film in transient based on experimental results.
Thank you so much again.
Regards
Â
-
February 12, 2018 at 11:47 pm
peteroznewman
SubscriberPlease tell me more about the wire material and the coil as a whole.
What is the total length of wire in the coil?
What is the diameter of the wire?
How many turns are in the coil?
Are all the coils planar (in one layer) or are the coils in multiple layers, and if so, how many?
What is the total resistance of the coil in Ohms?
How does the resistance change when the temperature goes up?
What is the voltage across the coil?
Is the circuit constant voltage or constant current?
Transient Thermal Optimization Example Model
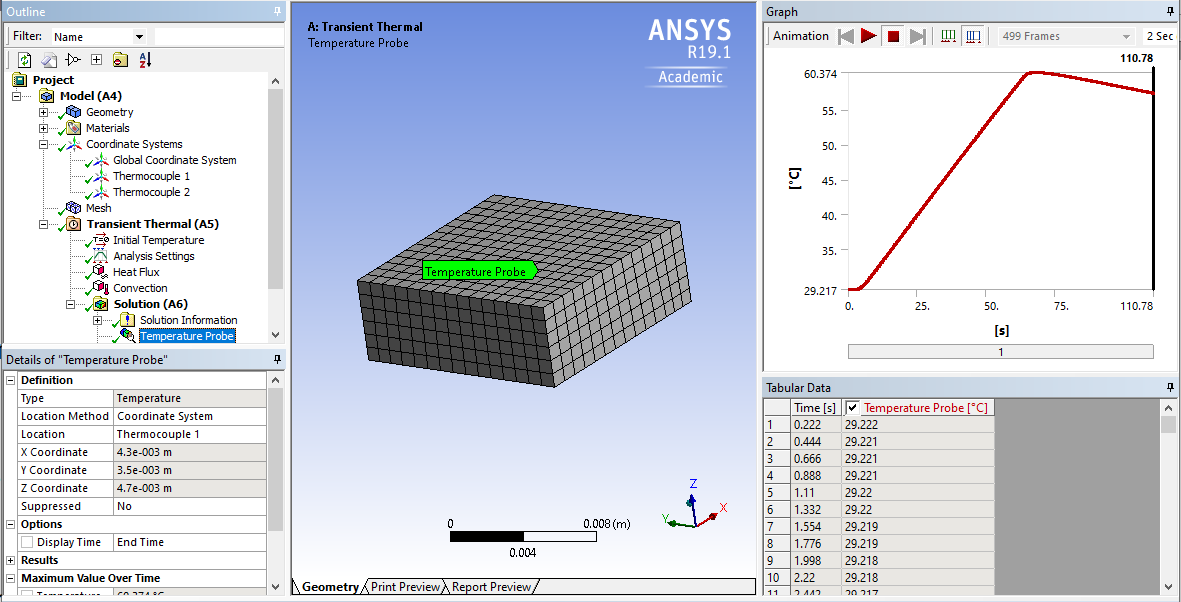
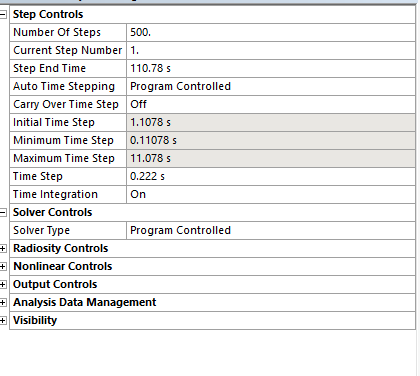
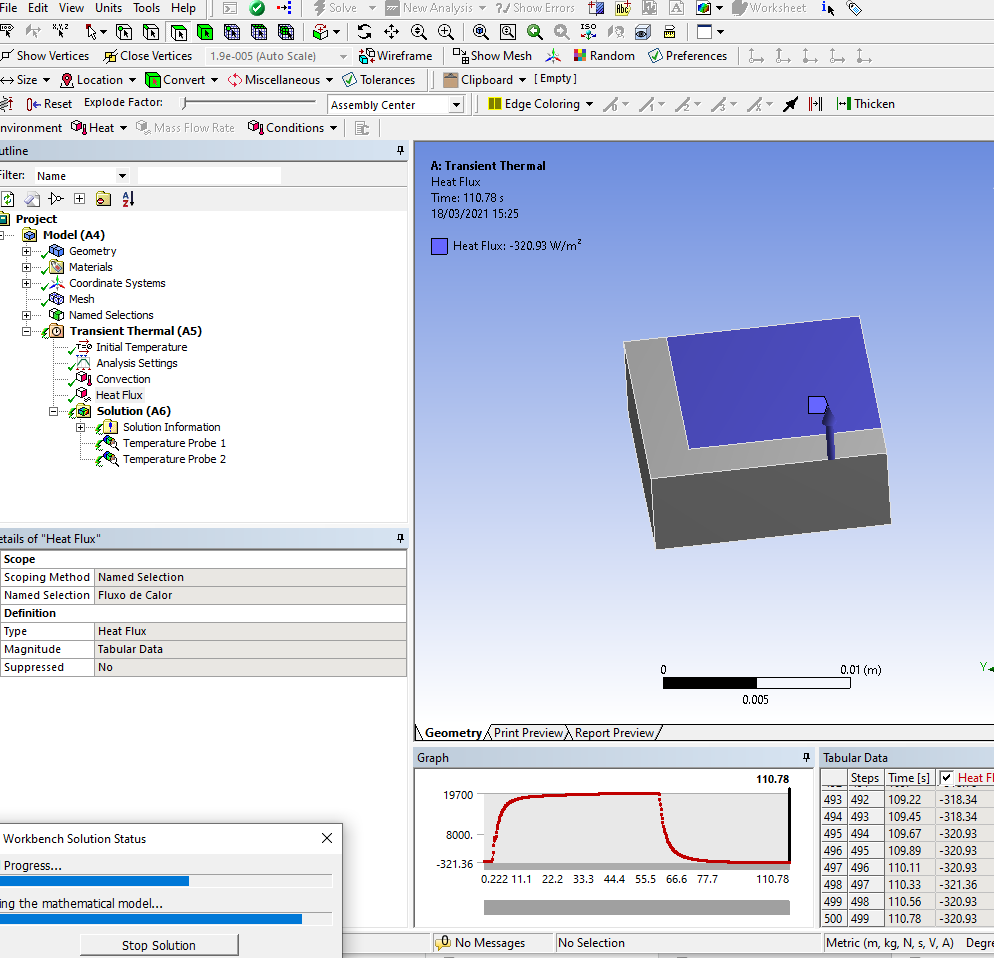
I created a very simple model that you can play with to learn some of the capabilities of ANSYS Design Optimization. It is just a circular wire with a parameter for the diameter, the wire body has an internal heat generation parameter and a heat transfer film coefficient parameter. It solves in 4 seconds and I can plot the time history of the surface temperature.
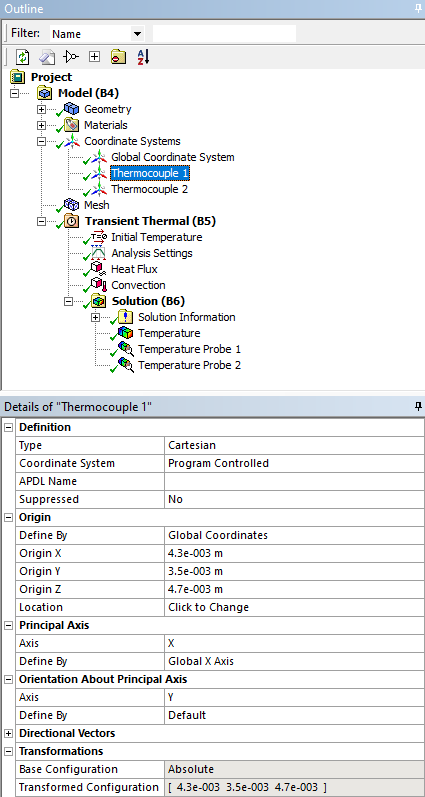
When you add parameters to an ANSYS model, you get a Parameter Set block in the Project Schematic.
That lets you easily type in values and solve that model in a table format. Below are 16 trials where I just typed in the values I was interested in and clicked Update.
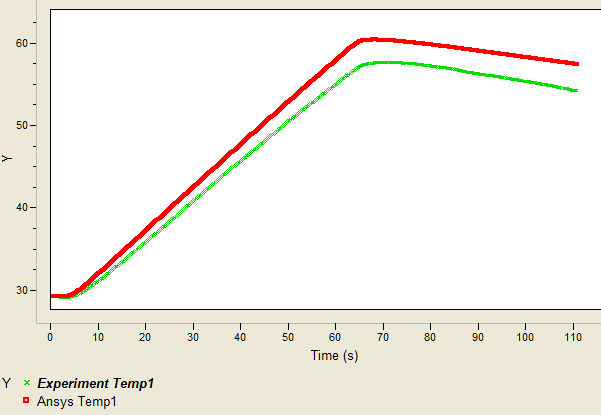
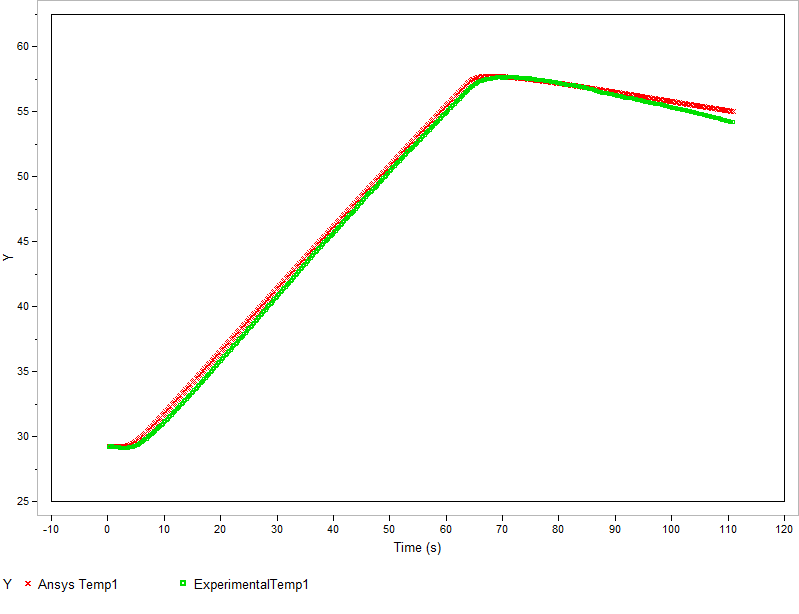
You provided some experimentally measured values.
If I take the temperature at 150 s = 46 C, 300 s = 54 C and 600 s = 62 C as target values, I can try to adjust the available parameters to match those targets.
An observation was that the Internal Heat Generation was a good parameter to adjust to get T600 to hit a target value of 62 C. I can do that by trial and error (or manually apply a bisection algorithm), or I can add a Direct Optimization block to the system.
Then I can tell ANSYS to search for the value of Internal Heat Generation that satisfies the objective that T600 = 62 C and it automatically searches, solving the problem 16 times to arrive at the value.
While that value satisfies T=600 target of 62 C, the T=150 value is 45.2 C so does not satisfy the target of 42 C, and that is where a two parameter optimization can be employed to vary the diameter and the internal heat to satisfy two objectives.
With two objectives, it has brought the T150 temperature on target, though the T600 has drifted off somewhat.
I hope these examples give you a taste for what is possible. There are many other tools in the Design Exploration toolbox, so I hope you try these out on your project.
Â
Â
-
December 2, 2020 at 9:33 am
iosif
SubscriberHi, peteroznewman.
I want to simulate a similar case but I have a question regarding your post.
How exactly do you use the intermediate temperatures (T600, T300 and T150) in the optimization? I see that you create a parameter for each one, but how does this expression look in CFD-Post?
Thank you!
-
December 14, 2020 at 6:39 pm
iosif
SubscriberHi Array
I am giving another shot at my question, above! :-)
Thank you.
-
December 14, 2020 at 8:53 pm
peteroznewman
SubscriberArray
This is a multi-objective optimization so there are three target values of temperature at the three times.
This is a Mechanical Thermal simulation, so there is no CFD-Post used. It's just the equation for convective heat transfer in the model.
-
March 16, 2021 at 10:03 pm
rogerio6497
Subscriber.
.Good afternoon, is it possible to estimate the heat flow (wm ^ -2) versus the time (s) entering the experimental temperatures in Celsis versus the time (inverse problem)? My 3D domain is a solid one. I do this using COMSOL Multiphysics 5.5 and the Levenberg – Marquardt algorithm. I appreciate the attention.
-
March 16, 2021 at 10:57 pm
peteroznewman
SubscriberArray
Please provide more details about your model. A Transient Thermal model can solve the heat flow vs time if you apply imported temperatures vs time.
-
March 17, 2021 at 11:40 am
rogerio6497
Subscriber.Good morning I thank you for your help. The following are the required information.
Properties of solid (3D):
Thermal conductivity k: 43.1 W/(m.K)
Density rho: 14900 kg/m^3
Heat capacity at constant pressure Cp: 332.94 J/(kg.K)
The files "Termocouple 1.txt" and "Termocouple 2.txt" contain the temperatures measured experimentally, in Celsius, versus the time in seconds.
The "Measured Heat flux for comparison.txt" file contains the experimental measured heat flow and can be used for comparison with the numerical inverse technique that will estimate the heat flow (W m^-2) versus time (s).
The files "solid_domain.igs" or "solid_domain.x_b" show the drawing made in SolidWorks for use in numerical simulation, drawn in mm.
The "Results using COMSOL.bmp" file presents the comparison of the heat flows estimated by the Nelder-Mead optimization technique and the heat flow measured experimentally.
Domain Point Probe 1:Â
Coordinates of thermocouple 1:
x: 0.0043 m; y: 0.0035 m; z: 0.0047 m
Domain Point Probe 2:Â
Coordinates of thermocouple 2:
x: 0.0035 m; y: 0.0089 m; z: 0.0047 m
Total sample size (x, y, z):
 0.0127 x 0.0127 x 0.0047 (m) = 1.27 x 1.27 x 0.47 (cm) =
12.7 x 12.7 x 4.7 (mm)
Data acquisition interval = 0.222000 seconds
Initial sample temperature = 29.2 (ºC) = 302.35 K
Number of thermocouples = 2
Coordinate (s) of the thermocouple (s):
x = 0.0043 (m) y = 0.0035 (m) z = 0.0047 (m)
x = 4.3 (mm) y = 3.5 (mm) z = 4.7 (mm)
x = 0.0035 (m) y = 0.0089 (m) z = 0.0047 (m)
x = 3.5 (mm) y = 8.9 (mm) z = 4.7 (mm)
Area (s) occupied by the heat flow (s)
xo = 0 x = 0.0104 m
yo = 0 y = 0.0104 m
zo = 0.0 z = 0.0
. -
March 17, 2021 at 1:39 pm
rogerio6497
SubscriberGood morning, please consider the convection boundary conditions with h = 20 ºC and Tinfinite = 29.221823 ºC. Ie:
heat transfer coefficient h: 20 W/(m^2.K)
External temperature Text: 29.221823 ºC
I appreciate it.
-
March 17, 2021 at 5:21 pm
peteroznewman
SubscriberArray
What version of ANSYS are you using?
-
March 17, 2021 at 5:22 pm
-
March 17, 2021 at 6:15 pm
peteroznewman
Subscriber.rogerio6497
Here is the face that begins at (0,0,0) and has a corner at (10.4,10.4,0) and is mentioned as the area occupied by the heat flow. I can put a Heat Flux on that face. Do all the other faces have a convection BC? That is the five other faces and the L shaped portion of this face?
. -
March 17, 2021 at 7:19 pm
rogerio6497
SubscriberYeS please consider this:
heat transfer coefficient h: 20 W/(m^2.K)
External temperature Text: 29.221823 ºC
thanks again
-
March 17, 2021 at 9:23 pm
peteroznewman
Subscriber.rogerio6497
To get started, I suggest you build a Transient Thermal model using the inputs you have defined and the measured Heat Flux as Tabular input. This graph shows the Temperature at Thermocouple 1.
Here is the comparison with the Experimental Data to the Ansys Data:
.
Changing some parameters like the Heat Transfer Coefficient could get the Ansys data closer to the Experimental data. -
March 17, 2021 at 11:30 pm
peteroznewman
Subscriber.rogerio6497
I made an adjustment to the Convection Film Coefficient to bring the Ansys simulation results closer to the experimental data, at least on the heating phase.
. -
March 18, 2021 at 12:00 am
rogerio6497
Subscriber -
March 18, 2021 at 1:09 am
peteroznewman
Subscriber.rogerio6497
You can't copy/paste the Heat Flux data until you set the End Time in Analysis Settings to 110.778 seconds.
Create two Coordinate Systems at the coordinates of the Thermocouples.
Use the Coordinate Systems to request a Temperature Probe.
.
I multiplied the Heat Flux by a constant factor and got this agreement between the Experimental and Simulation Temperature at Thermocouple 1. -
March 18, 2021 at 2:37 pm
-
March 18, 2021 at 6:50 pm
rogerio6497
Subscriber -
December 19, 2021 at 3:31 pm
Maher Al.
Subscriber.Hi Peter ,
I would like to do something like that for my cylindrical battery cell, can you please help me , at least can please attach this case u created for me to follow
thanks
.
-
- The topic ‘Feeding experimental data (temperature) in to Ansys to get conductivity’ is closed to new replies.
-
6379
-
1906
-
1457
-
1308
-
1022
© 2026 Copyright ANSYS, Inc. All rights reserved.


