TAGGED: export-data, rocky-dem
-
-
February 2, 2024 at 10:36 am
H Zhou
SubscriberHi,
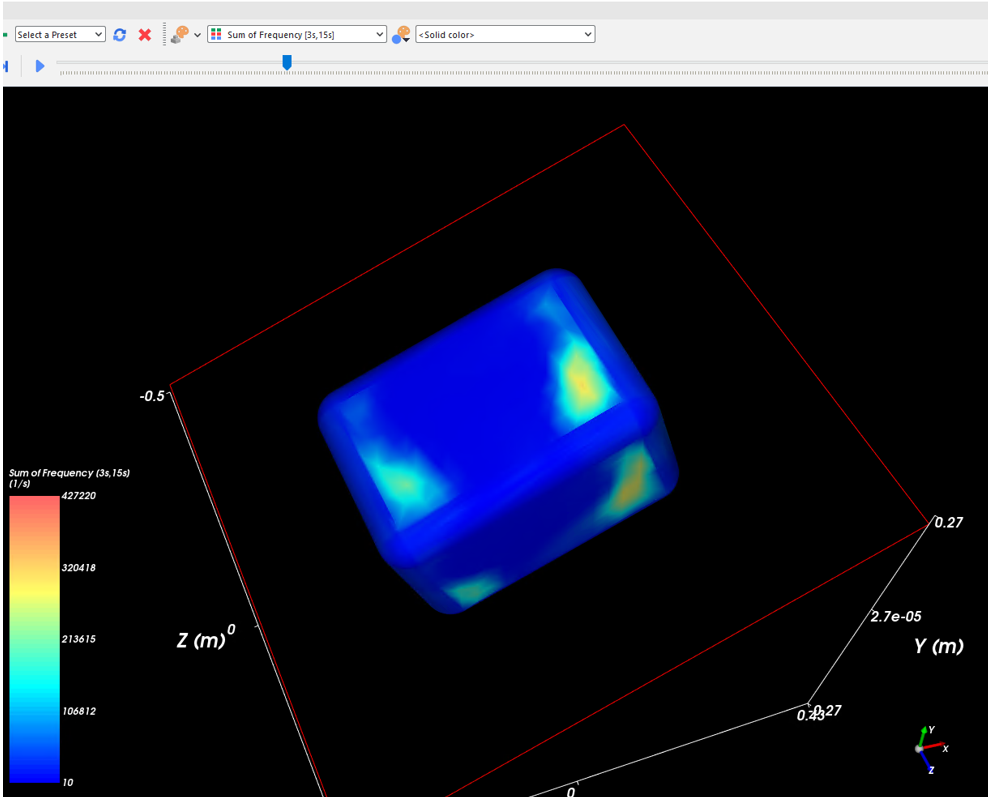
I’m seeking help exporting simulation data from Rocky. I have simulation results for particles moving inside a box-like boundary. The default display from Rocky is not very clear for the contact frequency between the particle and the boundary distribution. I want a better display or a more scientific way of showing the result. How can I export the accumulated frequency from Rocky results?
I opted for the Frequency in the Boundary Collision Module. Then displayed the sum of Frequency in the 3D view. The frequency at the corner is not properly displayed.
Thank you in advance
H.
-
February 6, 2024 at 6:12 pm
Lucas Bertollo Baggio
Ansys EmployeeHello Zhou,
Assuming that what is shown on the screenshot is your boundary, it seems like the procedure you are following is right, but something with your geometry seems to be wrong for the contacts computation, or there is something preventing particles to collide with the corners.
Consider checking your geometry triangles in Data Editors | Wall | Transform | Triangle Size and check in the 3D View if the particles are really getting in contact with the walls.
Feel free to continue this conversation right here, so we can find the best outcome for your case.
Best regards,
Lucas
-
February 8, 2024 at 12:35 pm
H Zhou
SubscriberHi Lucas,
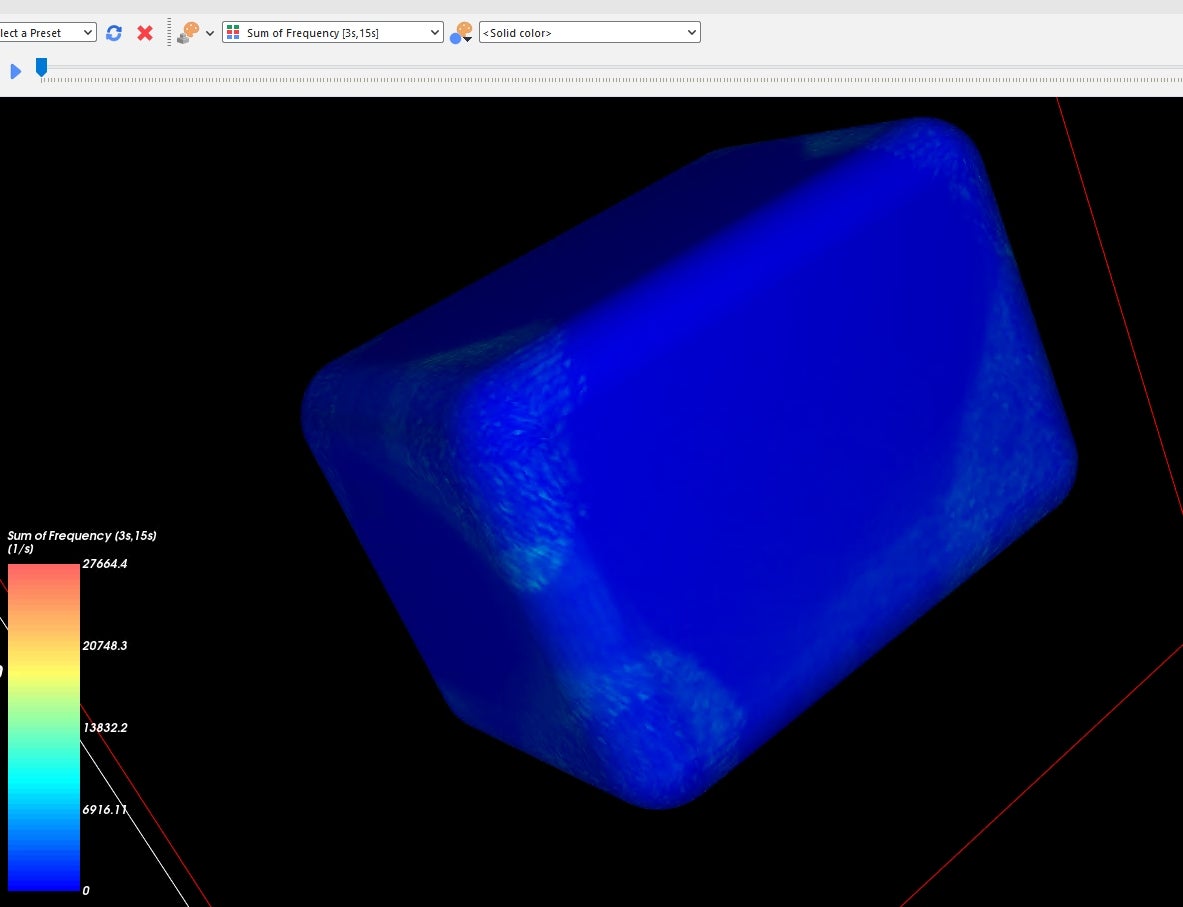
Thank you very much for your reply. I changed the triangle size to a smaller dimension and believe I have the right result this time as shown below. The coloured image itself is not very clear of showing the frequency. I'm wondering if there's a way of exporting the frequency with the geometrical coordinates so I can process this data with other drawing methods.
Regards,
Zhou
-
-
February 8, 2024 at 8:44 pm
Lucas Bertollo Baggio
Ansys EmployeeHi again Zhou, it's nice to see that you could fix your simulation issues! :)
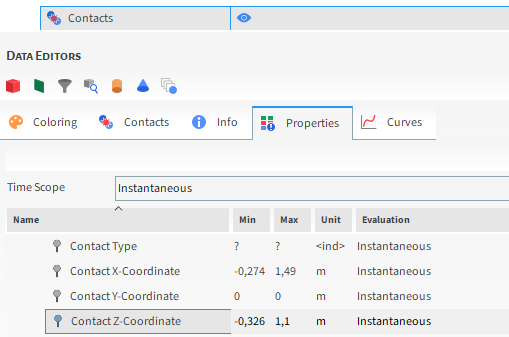
In order to export your contact coordinates, you might need to make use of Rocky PrePost:API, that you can get more information about by clicking on Help | Manuals | API:PrePost Manual in Rocky's menu. Thus, you will be able to get and export every contact coordinate through python.
You can also contact our Support Team for specific directions in this case.
Best regards,
Lucas
-
February 9, 2024 at 10:47 am
H Zhou
SubscriberHi Lucas,
Thank you for pointing me to the PrePost direction. I will try to figure this out.
Regards,
Zhou
-
February 14, 2024 at 2:33 pm
Lucas Bertollo Baggio
Ansys EmployeeHey Zhou,
In order to facilitate your access to manual information, I will try to give you more specific direction here.
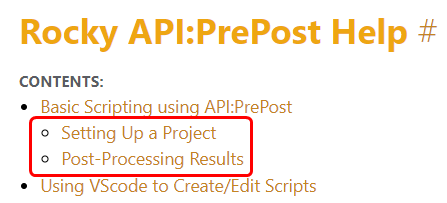
To set up and post-process your project using the API, learn about these sections:
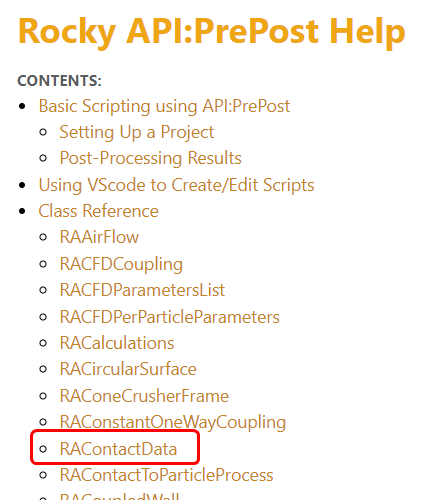
Then, to access your contacts&coordinates data, you may use the following section:
And you can access these grid functions (contacts coordinates):
by using .GetGridFunction(‘Property Name’):
FOR EXAMPLE:
contacts = study.GetContactData()
contacts_x = contacts.GetGridFunction('Contact X-Coordinate')
So you can export the data you got to a .csv with python tools.
Best regards,
Lucas
-
February 14, 2024 at 5:57 pm
H Zhou
SubscriberHi Lucas,
Thank you for the detailed instructions. I will give it a try and post the result later.
Zhou
-
-
-
- The topic ‘Export frequency data from Rocky DEM simulation’ is closed to new replies.


- LPBF Simulation of dissimilar materials in ANSYS mechanical (Thermal Transient)
- Convergence error in modal analysis
- APDL, memory, solid
- Meaning of the error
- How to model a bimodular material in Mechanical
- Simulate a fan on the end of shaft
- Real Life Example of a non-symmetric eigenvalue problem
- Nonlinear load cases combinations
- How can the results of Pressures and Motions for all elements be obtained?
- Contact stiffness too big

-
4167
-
1487
-
1338
-
1188
-
1021

© 2025 Copyright ANSYS, Inc. All rights reserved.

