-
-
November 30, 2023 at 2:10 pm
Aras karimi
SubscriberHi to all,
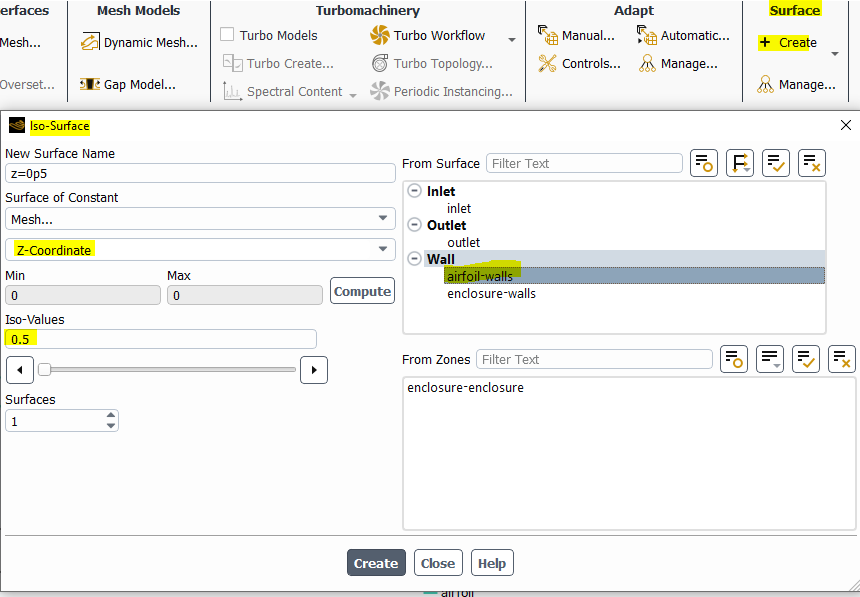
I am simulating a 3D airfoil whose span length is 1 meter. Now I want to draw the pressure coefficient of the wing at Z=0.5m , that is, exactly in the middle of the wing span.
I was able to plot the pressure coefficient on the whole wing from the Plots -->> X-Y Plot section in Fluent. But I exactly want to plot the pressure coefficient distribution in the middle of the wing span.
I appreciate any help.
Regards
-
November 30, 2023 at 4:40 pm
Federico
Ansys Employee-
November 30, 2023 at 8:44 pm
Aras karimi
SubscriberI managed to draw it for the steady state flow. But I am confused to draw it in transient flow.
I am doing a transient simulation. Now I stopped the solution now to plot the pressure coefficient distribution on the wing.
Can I draw the pressure coefficient diagram from the section Plots -->> X-Y Plot as in steady flow mode or should I activate the Data Sampling For Steady Statistics option and continue the simulation?
I would be grateful if you could tell me how to output the distribution of the pressure coefficient in transient simulation mode.
-
-
November 30, 2023 at 8:50 pm
Federico
Ansys EmployeeHello Aras,
if you're doing the proposed method above after stopping the transient solution, you will get a snapshot of the pressure coefficient at the current flow time.
With Data sampling, you can get a time-averaged cp for the duration of the sampling period.
-
December 1, 2023 at 4:54 am
Aras karimi
SubscriberWell, now I have stopped solving transit. I activated the Data Sampling option and continue to solve for 3 harmonic oscillation periods, which is equal to 500 time steps. Now let's assume that the solution is finished.
Now, to draw the time-averaged pressure coefficient, should I go to the same Plots -->> X-Y Plot in Fluent or should I do something else?
-
-
- The topic ‘Airfoil pressure coefficient’ is closed to new replies.


-
2979
-
970
-
857
-
755
-
599

© 2025 Copyright ANSYS, Inc. All rights reserved.


