

TAGGED: efficiency-maps, Machine-Toolkit
-
-
August 12, 2021 at 4:29 pm
hkanakri
SubscriberHello All,
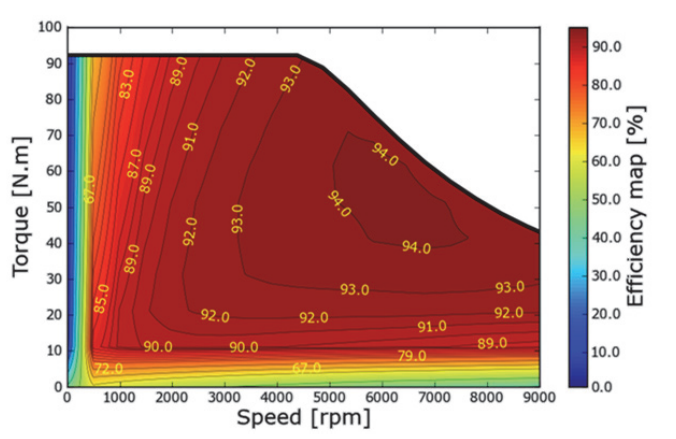
I need to display the contour lines on the efficiency maps with the efficiency values Using Machine toolkit, to produce a map similar to the one below. Any suggestions how to do it?
August 20, 2021 at 1:48 pmDELI
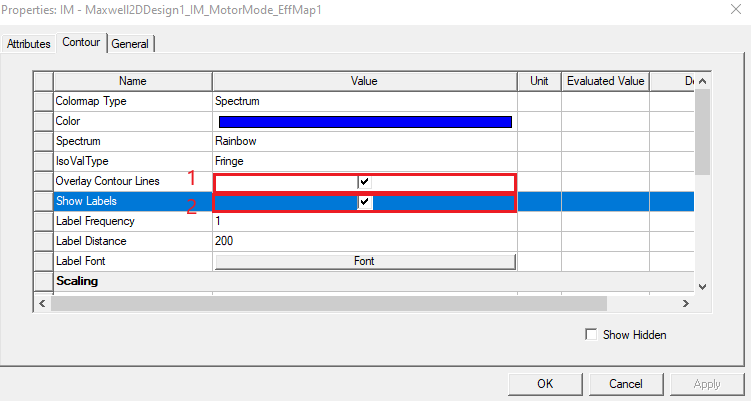
Ansys Employeedouble click on the color legend and the property window will pop up:
In contour tab, check overlay contour lines and show labels boxes.
August 20, 2021 at 6:53 pmSubscriberHello Deli,
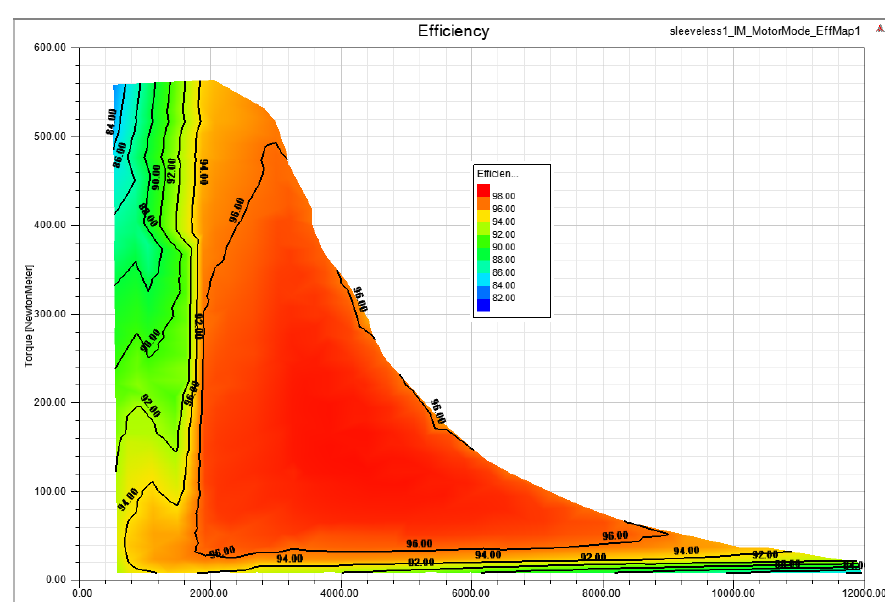
This is great, and solved the issue. Thank you so much!
-Haitham
May 23, 2022 at 4:29 pmphuonganhlovely.me
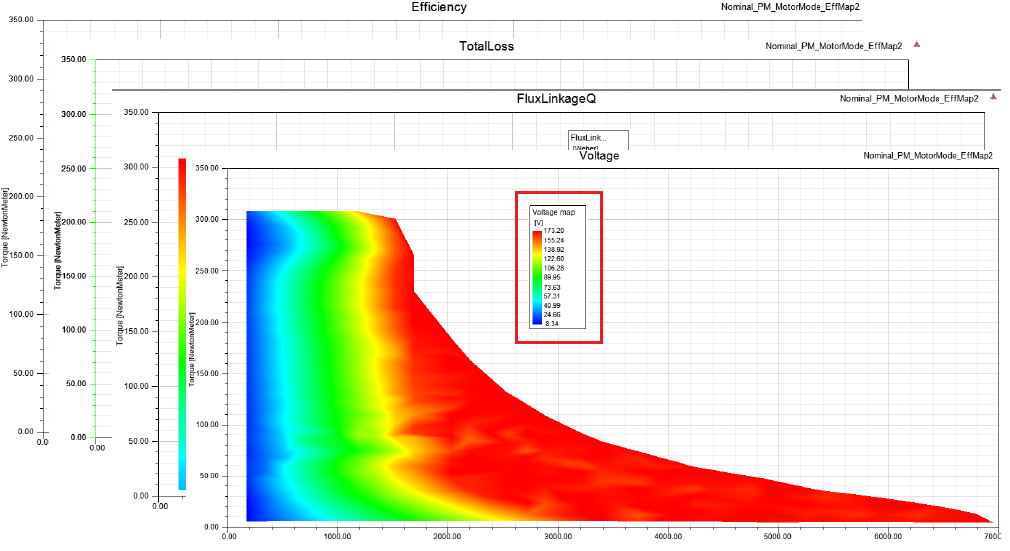
SubscriberHello guys I am using EDT to simulate an axial flux motor (3D model), and now I want to plot the efficiency map using a machine toolkit.
The question is when I finished simulating the machine toolkit how can i plot efficiency map, current and voltage plots, output power.... same figure above?
can you provide screenshots of your Machine toolkit setup and preprocessing steps ( i mean the explanation of each pages of Machine toolkit setup) or where can i get information to do it ?( i have read Maxwell ACT Extensions Wizards in PDF file and still vague about it)
it is perfectly if you can help
Thanks in advance
Viewing 3 reply threads- The topic ‘Display the contour lines on the efficiency maps Using Machine toolkit’ is closed to new replies.
Innovation Space Trending discussions
 Top Contributors
-
peteroznewman
 6379
6379 -
scabo
 1906
1906 -
Dennis Chen
 1457
1457 -
javat33489
 1308
1308 -
Shyam Prasad V Atri
1022
Top Rated Tags
© 2026 Copyright ANSYS, Inc. All rights reserved.
Ansys does not support the usage of unauthorized Ansys software. Please visit www.ansys.com to obtain an official distribution.
-


The Ansys Learning Forum is a public forum. You are prohibited from providing (i) information that is confidential to You, your employer, or any third party, (ii) Personal Data or individually identifiable health information, (iii) any information that is U.S. Government Classified, Controlled Unclassified Information, International Traffic in Arms Regulators (ITAR) or Export Administration Regulators (EAR) controlled or otherwise have been determined by the United States Government or by a foreign government to require protection against unauthorized disclosure for reasons of national security, or (iv) topics or information restricted by the People's Republic of China data protection and privacy laws.
