Plotting and Exporting Data in Ansys Lumerical FDTD — Lesson 5
Visualizer
The visualizer is a plotting tool that allows simple manipulation of plot settings and lets you select the desired data to plot from multi-dimensional datasets through the graphical user interface. The main features of the visualizer window are introduced below.
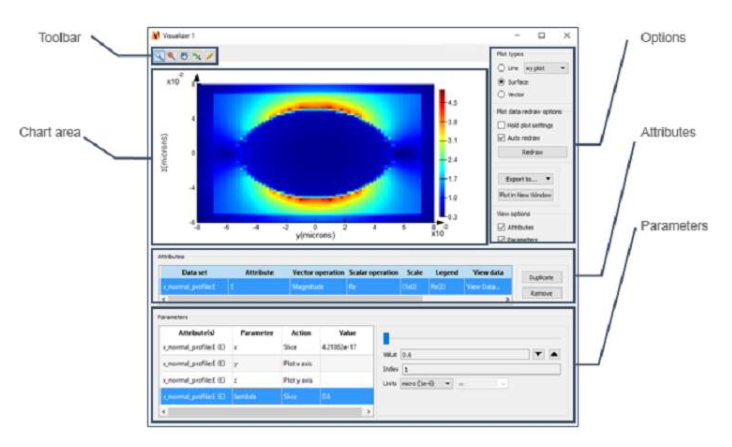
Attributes:
- Data set: Lists the available datasets that have been sent to the visualizer.
- Attribute: Selects the dataset attribute to the plot.
- Vector operation: Choose to plot a field component or magnitude of the selected attribute.
- Scalar operation: Apply operations to plot the real part, imaginary part, absolute value, etc.
- Scale: Apply a scaling factor to change the units of the data.
- Legend: For line plots, labels the line corresponding to the data.
- View data: Opens a new window containing a table displaying the values of the data points currently plotted.
- Duplicate/Remove buttons: remove or duplicate the selected dataset in the Attributes list.
Parameters:
- Attribute(s): Lists the dataset and attribute that the parameter is associated with.
- Parameter: Displays the parameter name.
- Action: Selects whether to plot the parameter along the x- or y-axis of the plot, or use the “Slice” option to plot data from one particular data point. If using “Slice,” the panel on the right of the Parameters table will allow you to choose the value to the plot.
- Value: Displays the value of the parameter that is plotted.
Toolbar:
- Allows you to choose mouse mode: Select, zoom or pan.
- Zoom extent button: Zooms the chart axis range to include all data points.
- Export buttons: Exports current plot to an image file or MATLAB figure.
- Chart settings button: Opens the “Chart settings” panel which lets you set options such as:
- Title and legends
- Plot axis range and ticks
- Color bar scale
- Linear/log scale
Options:
- Plot types: Select the type of plotline, surface or vector.
- Plot data redraw options: Choose to hold the current plot settings or automatically redraw the plot when the selected options in the Attributes table are modified.
- If “Auto redraw” is not selected, the chart is only updated when the “Redraw” button is clicked.
- Export options: Using the “Export to…” button, export data from the current plot to a JPEG or text file; copy the data to the clipboard; or use the “Plot in New Window” button to generate a new figure window with the current plot data.
- View options: Choose to show or hide the Attributes or Parameters table.
Using visualizers:
Data can be sent to visualizers in the graphical user interface by right-clicking on a monitor or object containing data in the Objects Tree, or right-clicking on a result in the Result View window and choosing the “Visualize” option.
Multiple datasets can be visualized in the same plot when plotting line plots. Additional visualizer windows can be opened at the same time.
If matrix data is sent to the visualizer, the matrix will be treated as the attribute with parameters named index_1, index_2, etc., for each dimension of the matrix. The index parameters refer to the element number of the matrix data.
Figure Windows
The following video demonstrates the settings of a figure window. To follow along with the demonstration, generate the example figures by running the associated script file.
Data Export Methods
You might want to save simulation results as figures, texts or numbers. In this video lesson, you will learn about various ways to export the data.
You are being redirected to our marketplace website to provide you an optimal buying experience. Please refer to our FAQ page for more details. Click the button below to proceed further.