Photo credit: Mike Bird @ Pexels
Introduction
Creating a graphical user interface (GUI) can greatly simplify and enhance interaction with complex models (for example, during debugging, by introducing into a model user-defined inputs using a panel). In this article, we’ll show just how quick and easy it is to build a Rapid Prototyper graphical panel to drive a model simulation in Scade One.
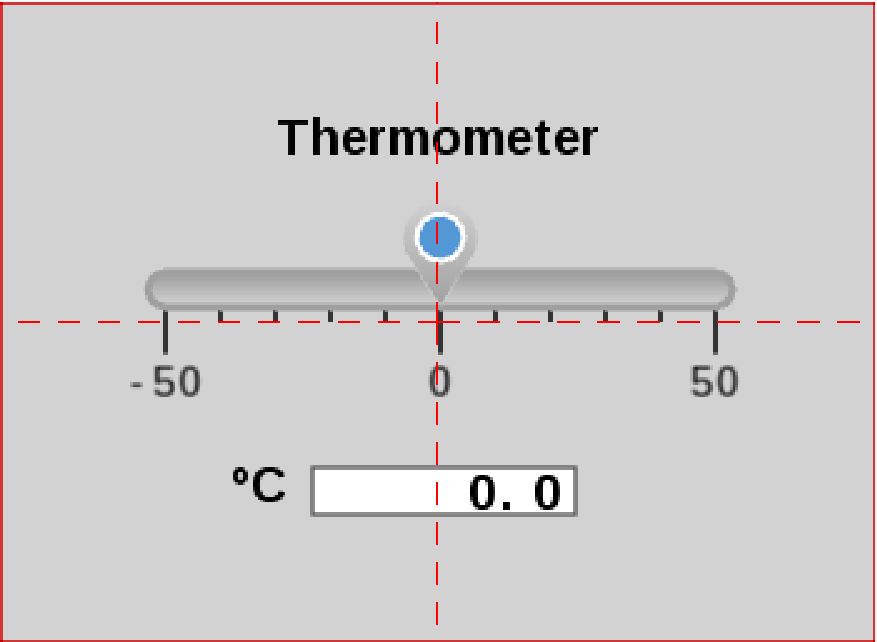
We’ll walk through the process of creating a simple graphical panel and integrating it with a Thermometer model to set and visualize a temperature value. The temperature displayed in Celsius will be converted to Fahrenheit. Here’s a sneak peek of what we’ll achieve:
Rapid Prototyper Workflow
Designing a graphical panel for our Thermometer model involves a few key steps:
- Create a graphical panel in Rapid Prototyper.
- Define the panel’s inputs/outputs that will connect with the Thermometer model in Scade One.
- Generate the co-simulation files.
- Integrate the graphical panel with the Thermometer model in Scade One.
- Execute the model with the graphical panel.
Create a Graphical Panel
Let’s make a simple thermometer panel containing a temperature sensor and a numeric display for visualization. Using the panel, we will specify a temperature with the slider widget, and this temperature will be shown on the display.
We start by initiating a Rapid Prototyper project with the following name: ThermometerPanelProject. Then, we add a new graphical panel, called a specification, to the project. We name the panel ThermometerPanel and choose a Custom template of 350×256 pixels.
How can we customize the panel? It is possible to adjust the panel size, change the color table and select a different background color, change the line styles, etc. The Rapid Prototyper help provides all the information we need to customize panels.
Now, it’s time to design our panel. To do this, we simply grab widgets from the Widget Library. It is a library that comes with Rapid Prototyper, and includes widgets organized into categories. We add a Slider and a Numeric Display, from the Buttons and Indicators folders respectively. We also add a Text from the Objects Palette.
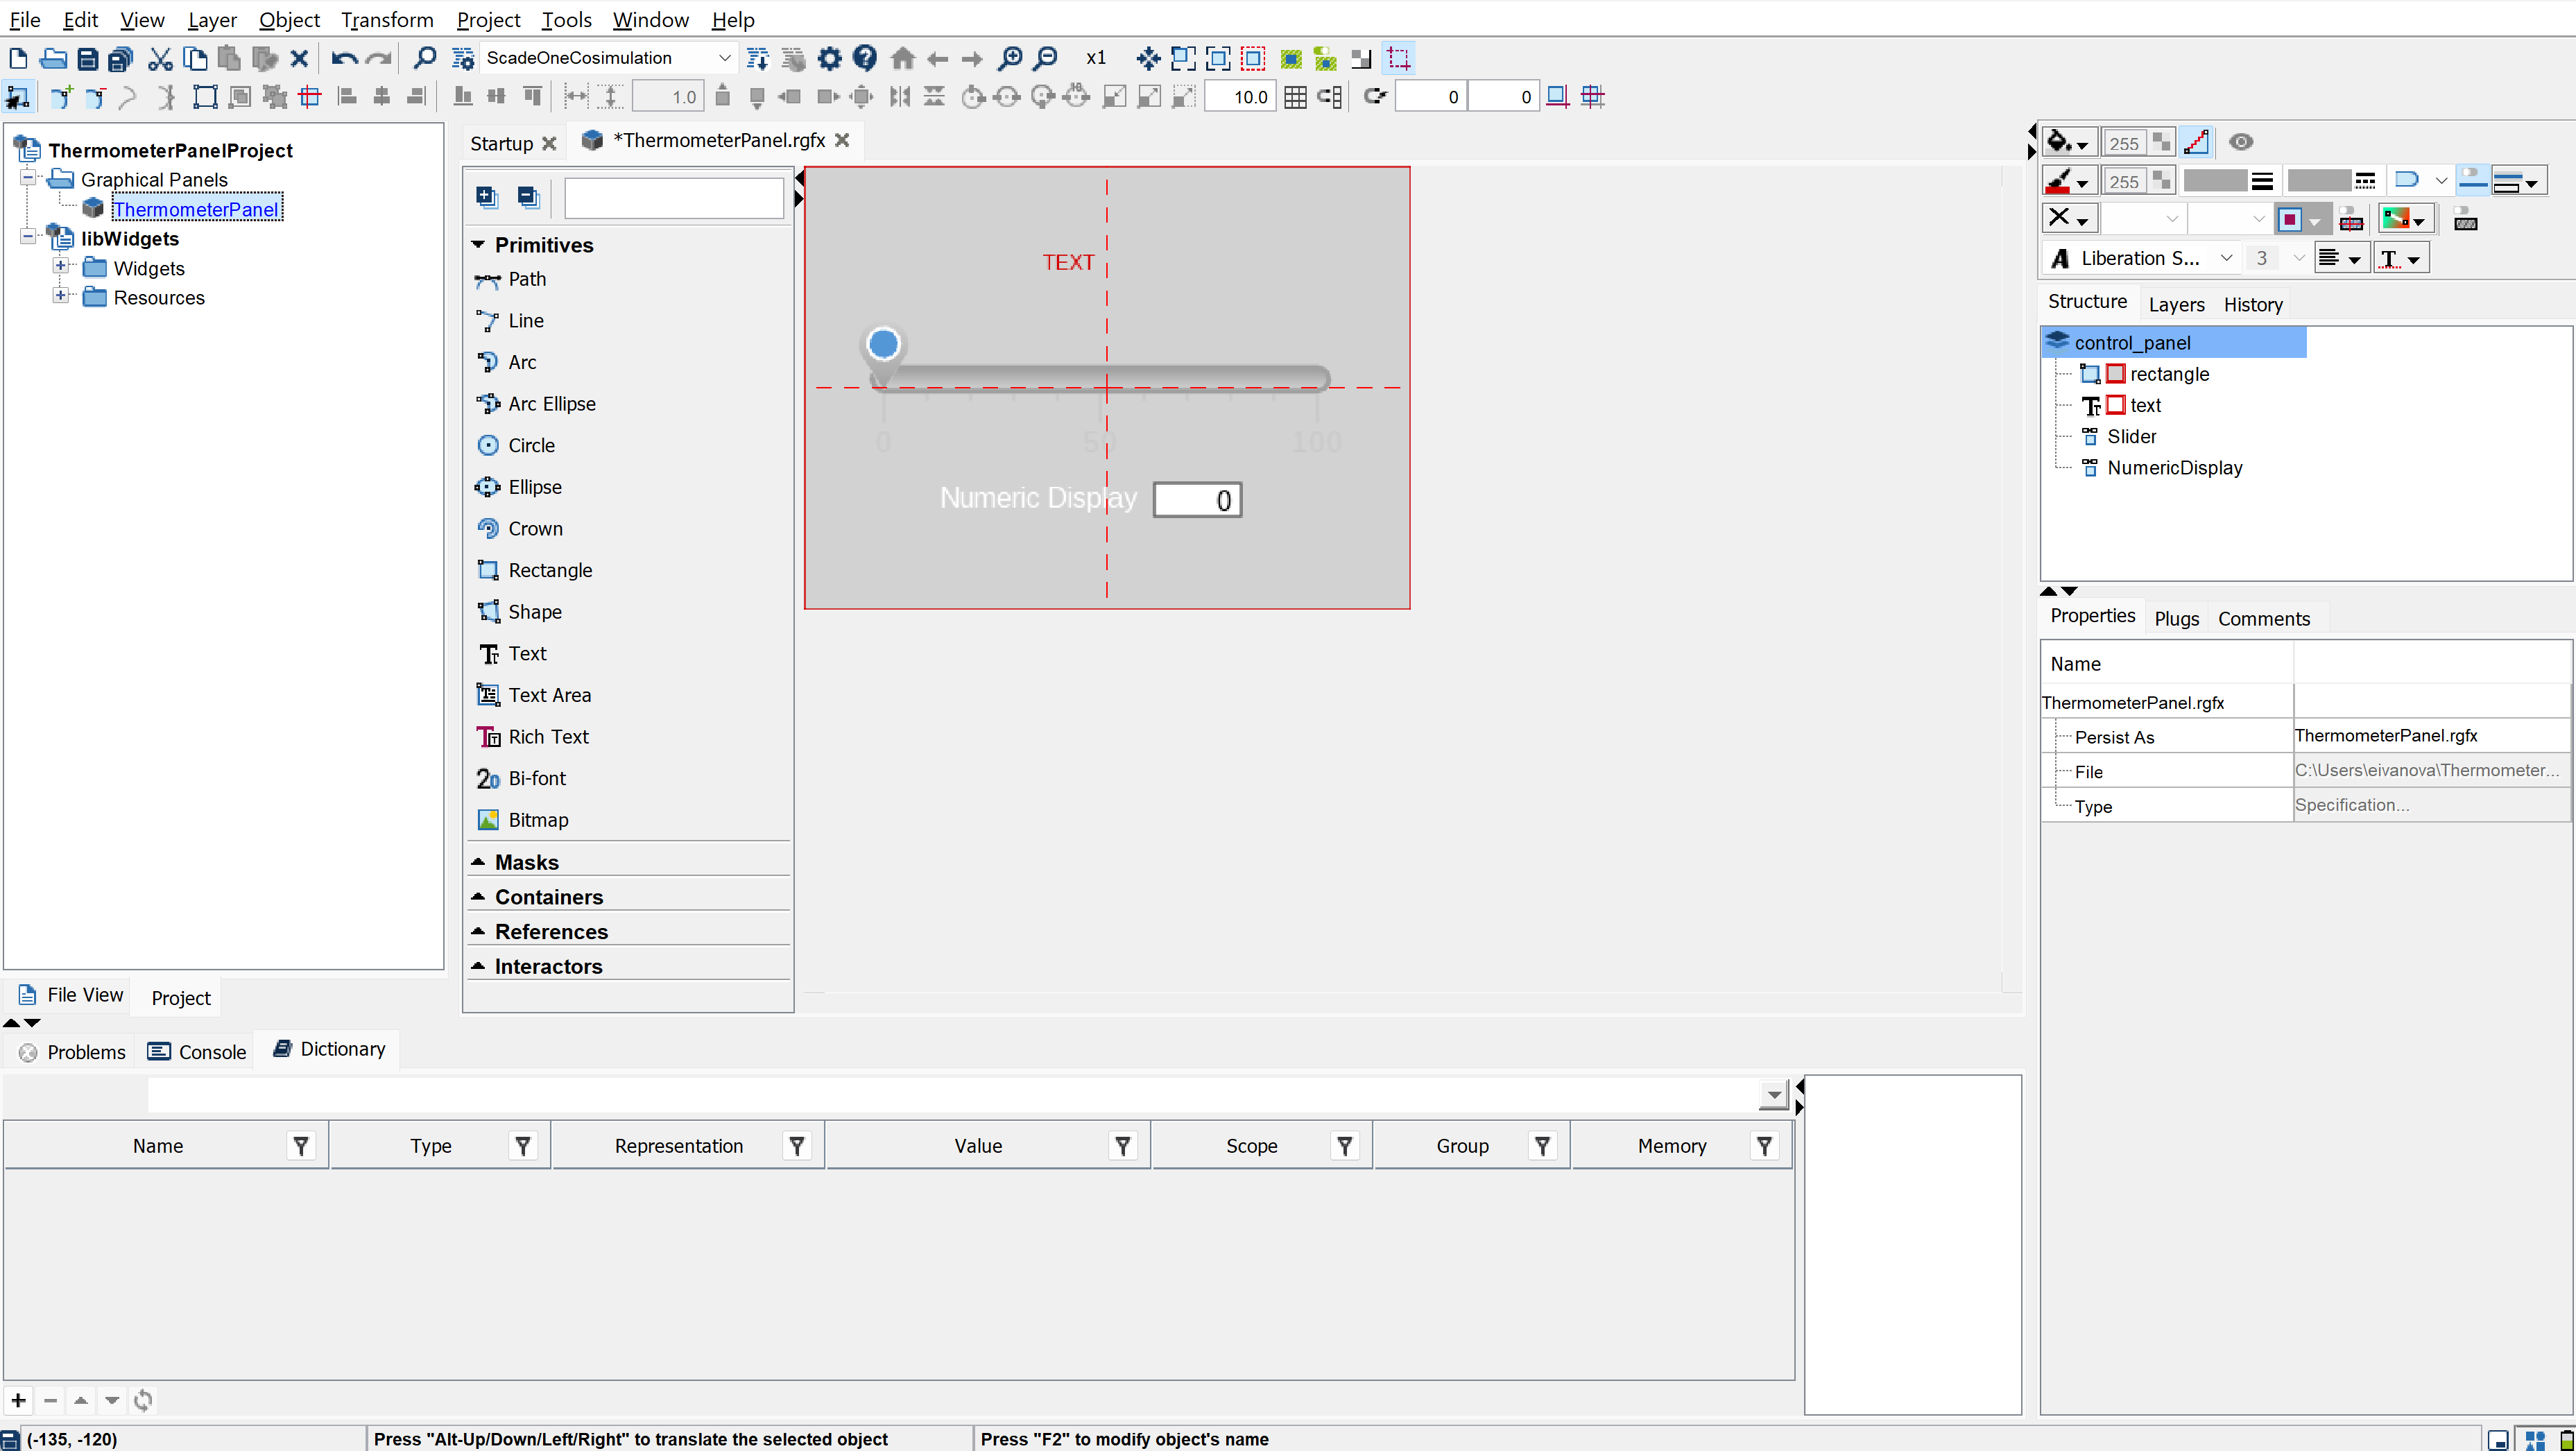
From the Properties panel, we set widget parameters such as value range, size, text option etc.
After applying the parameters from the table below, we obtain the following results:
|
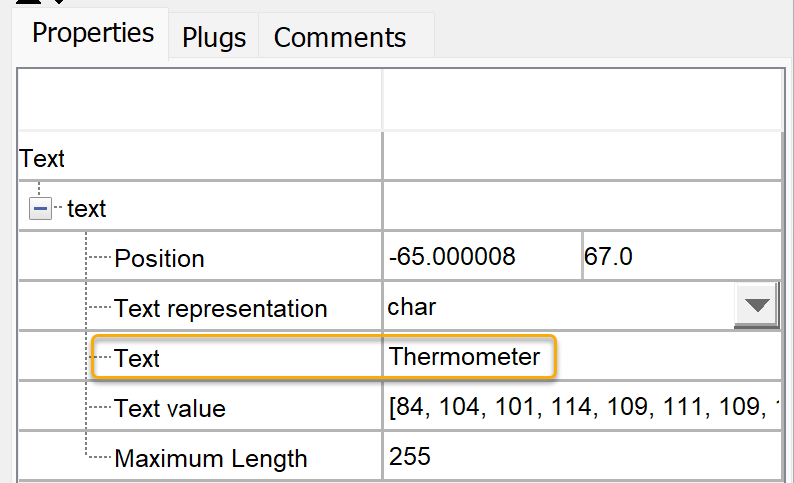
Text
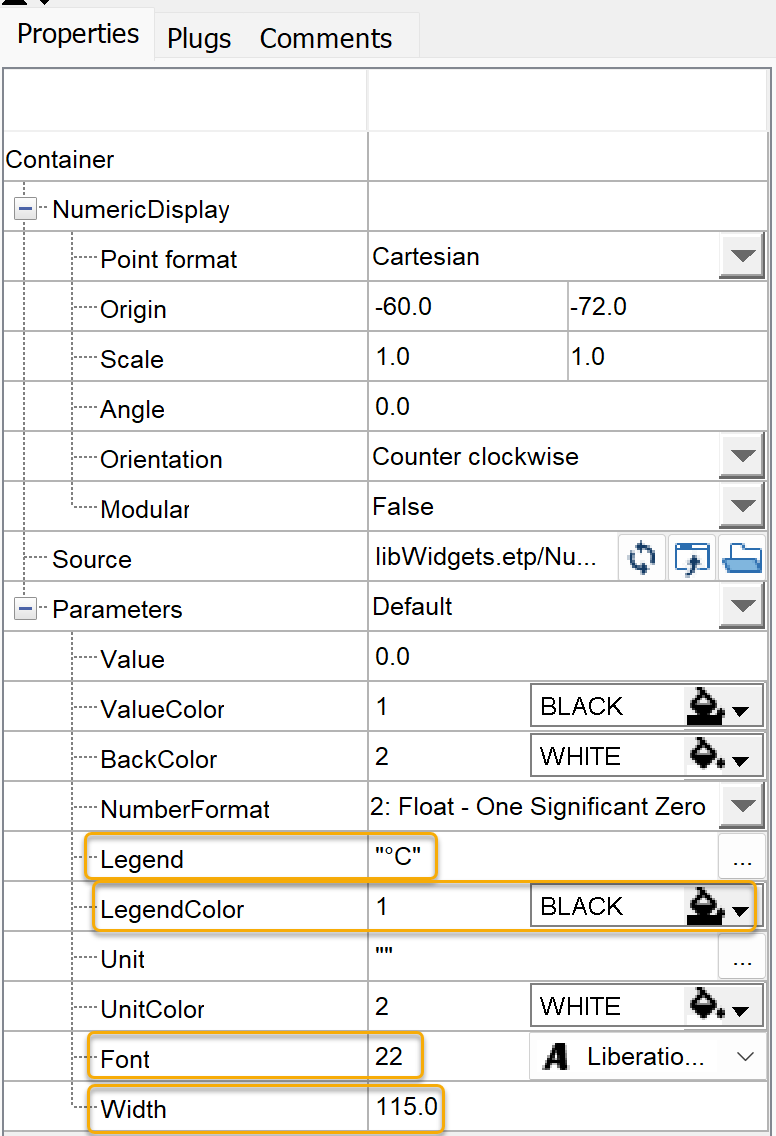
Numeric Display
|
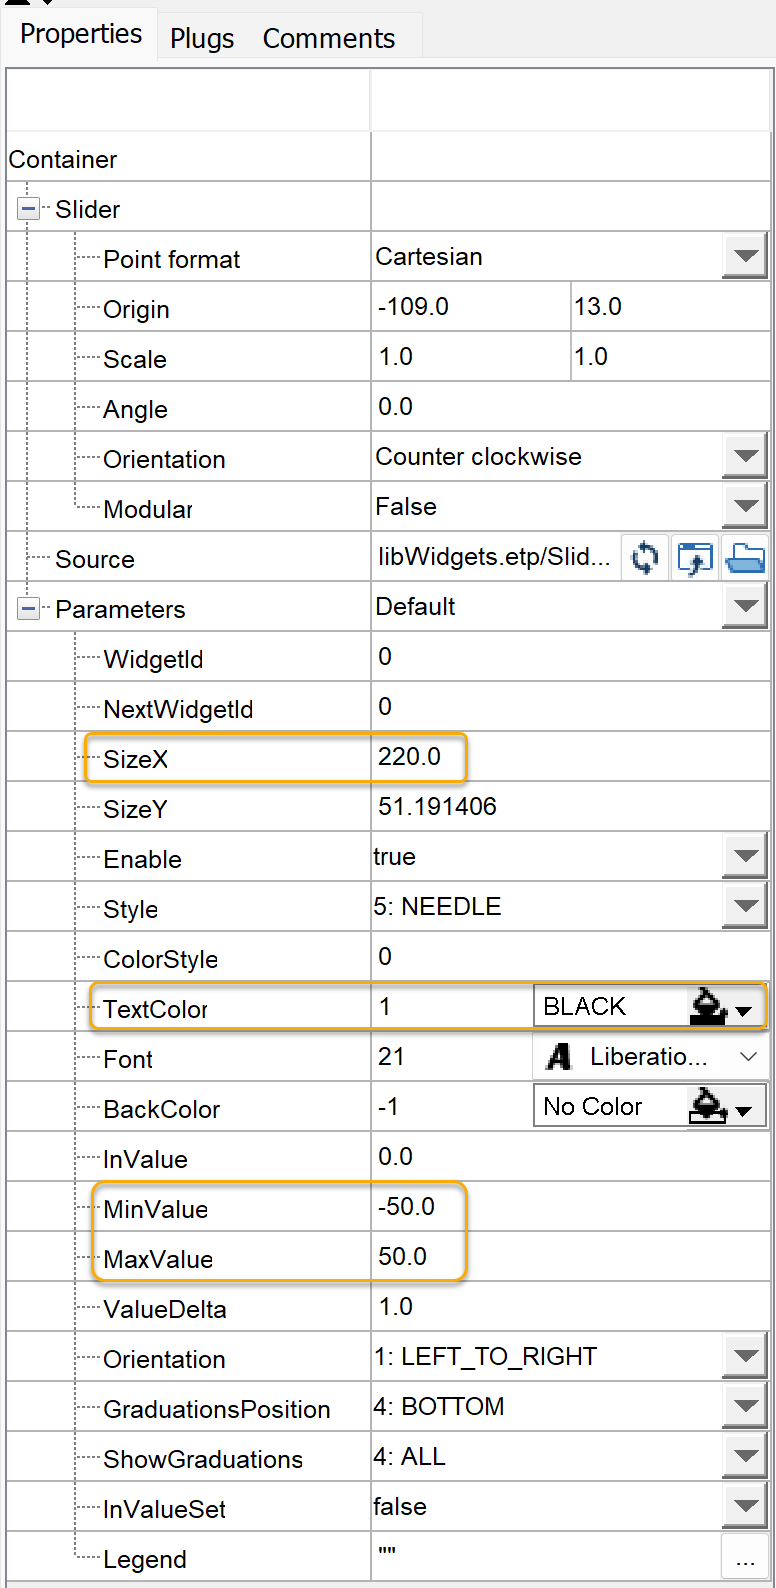
Slider
|
Each widget’s parameter can be connected to a variable so that this parameter can be dynamically modified according to this variable. This type of connection is called a plug. Plugs are used to connect widgets together and with the external world. Typically, we declare these variables in the Variables Dictionary and plug the widget parameters from the Plugs panel.
Basically, a thermometer reads the temperature from a sensor, converts the signal to a digital value, processes it, and displays the result. In our panel, the variable (flow) representing the temperature value is sent as an output by the slider widget (instead of a sensor). This variable is then received as an input by the numeric display. It is also an output of the panel, which can be connected to the Scade One model. So, we need to define only one variable into the Variables Dictionary – let’s name it tempCelsius – and plug it to the value parameter of each widget.

Variable Dictionary
|
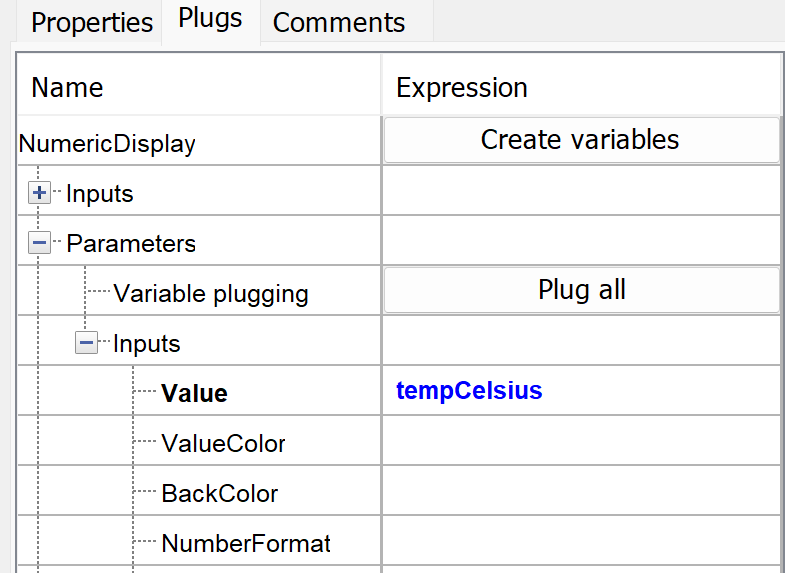
Numeric Display
|
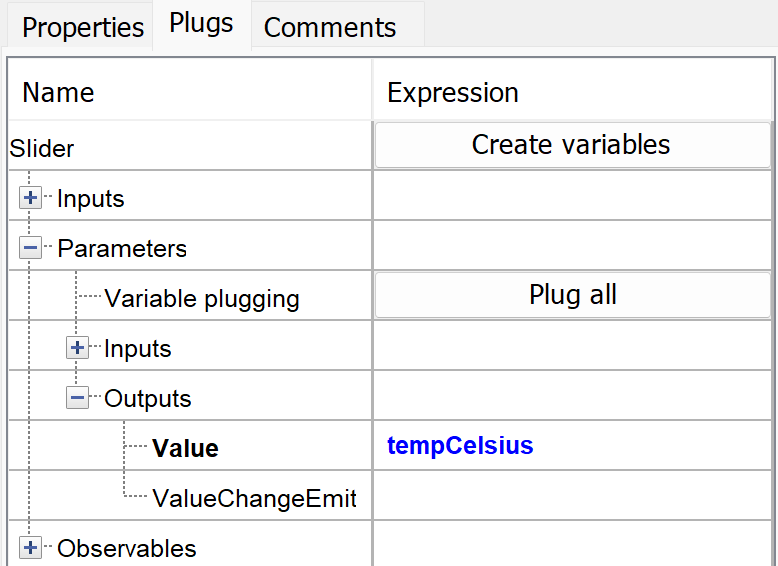
Slider
|
Note: In the video below, we plug the variable before even declaring it in the Variables Dictionary, which can be done automatically right after with the click on the button Create Variables.
Generate the Co-Simulation Files
We’re done with the creation of the panel. Now let’s configure and launch the generation of the co-simulation files.
In this configuration, we need to set the following options:
- source (our panel): ThermometerPanel.rgfx
- panel name: ThermometerPanel
- integration mode: Asynchronous (this option is required to run the panel interactively, step by step in the debug mode, during model execution)
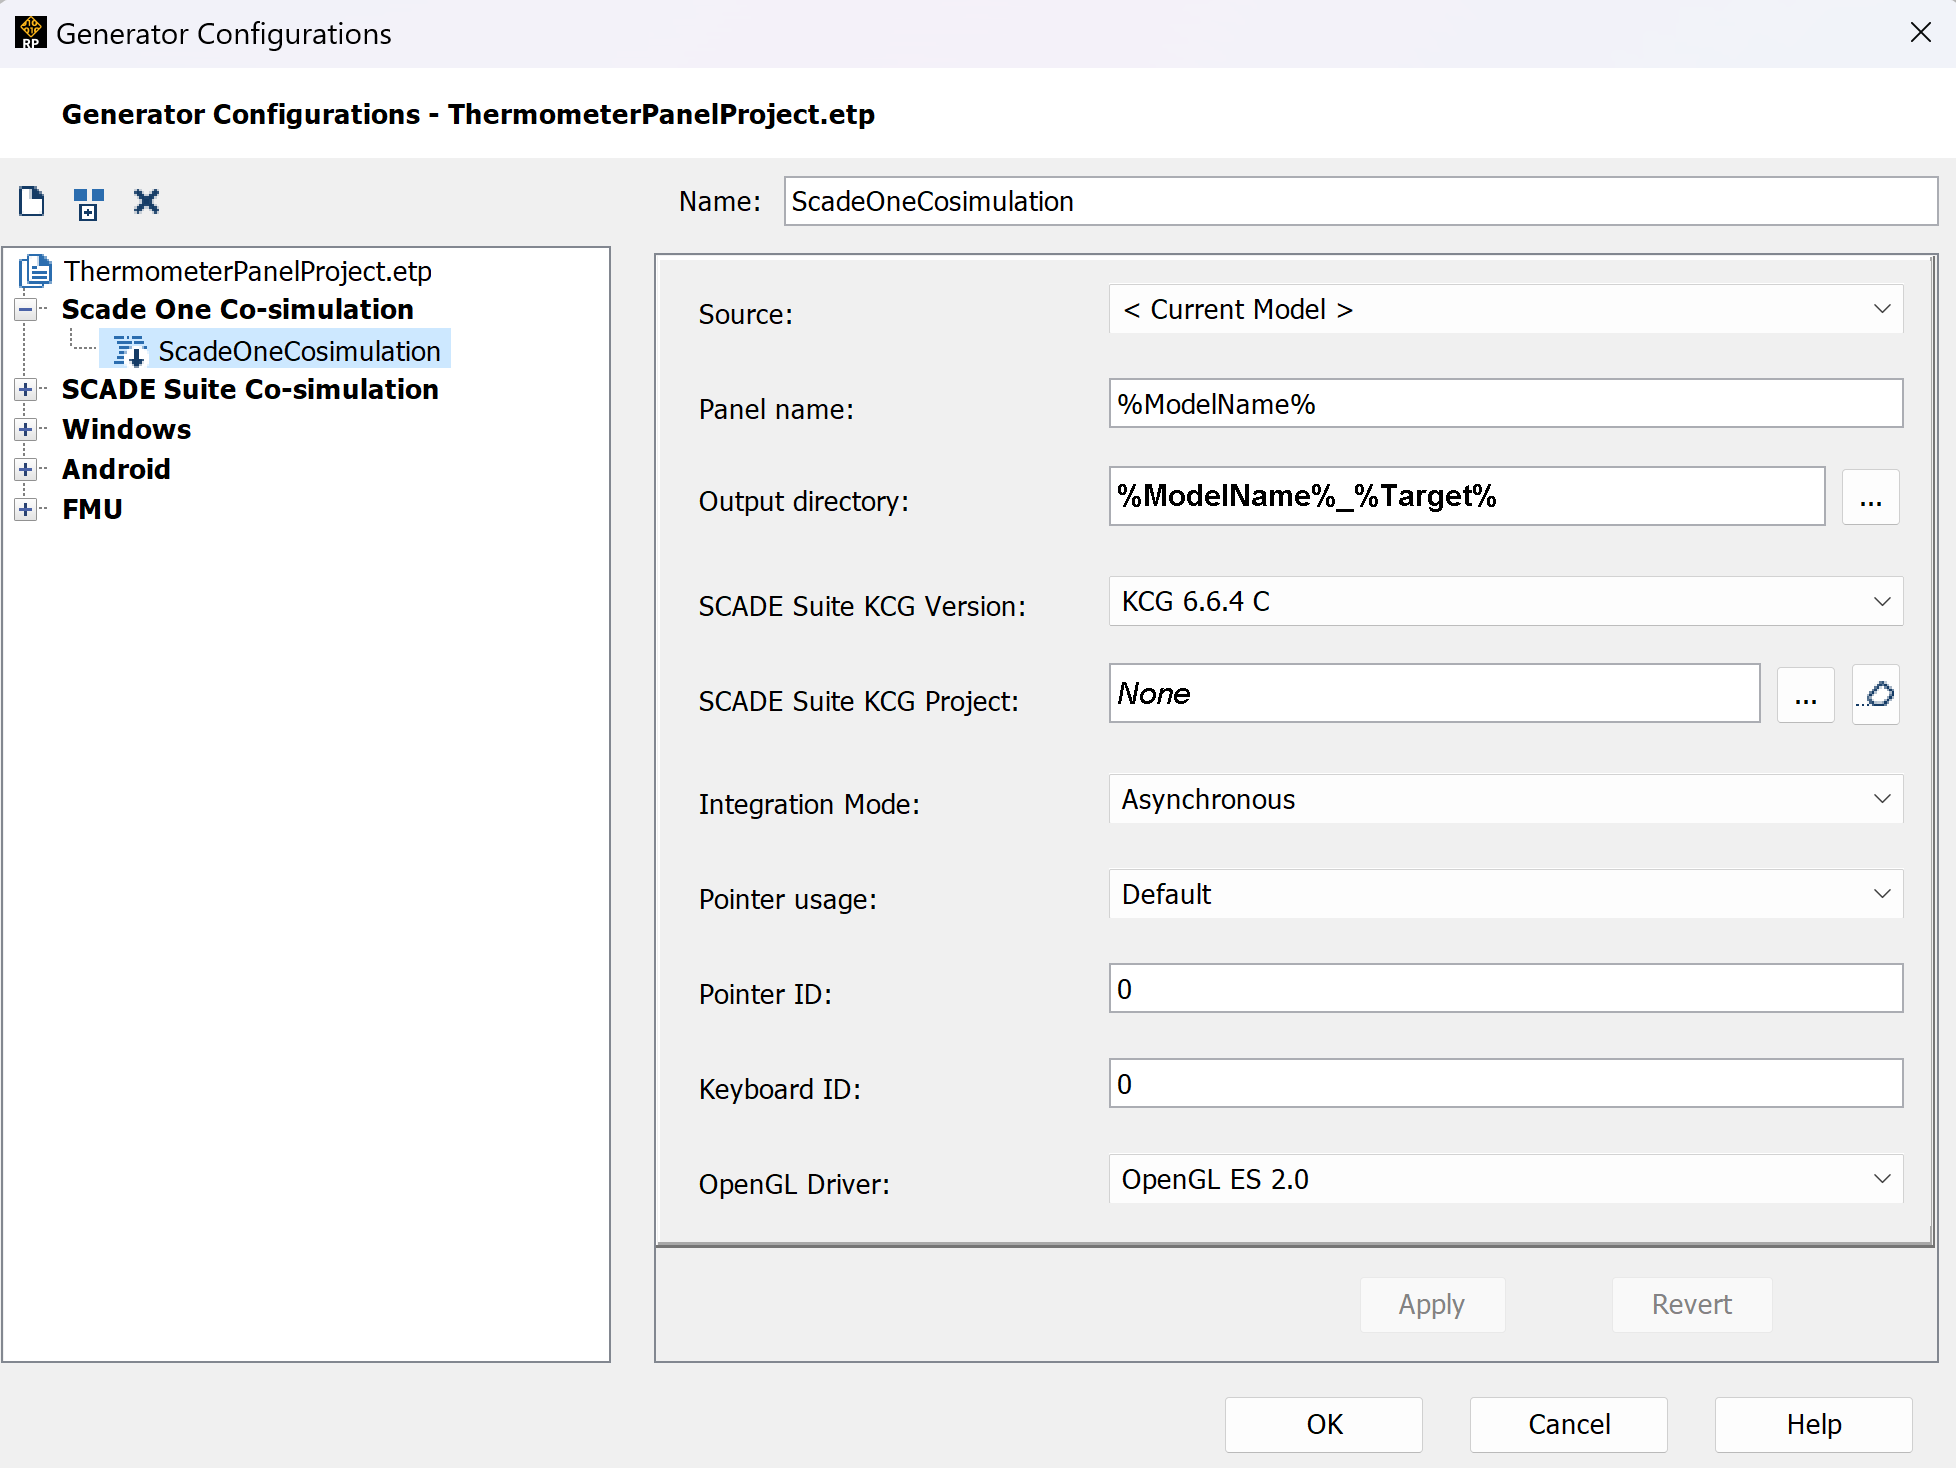
Then, just one click of a button is enough to generate the files.
Let’s browse the output folder to see what these co-simulation files are:
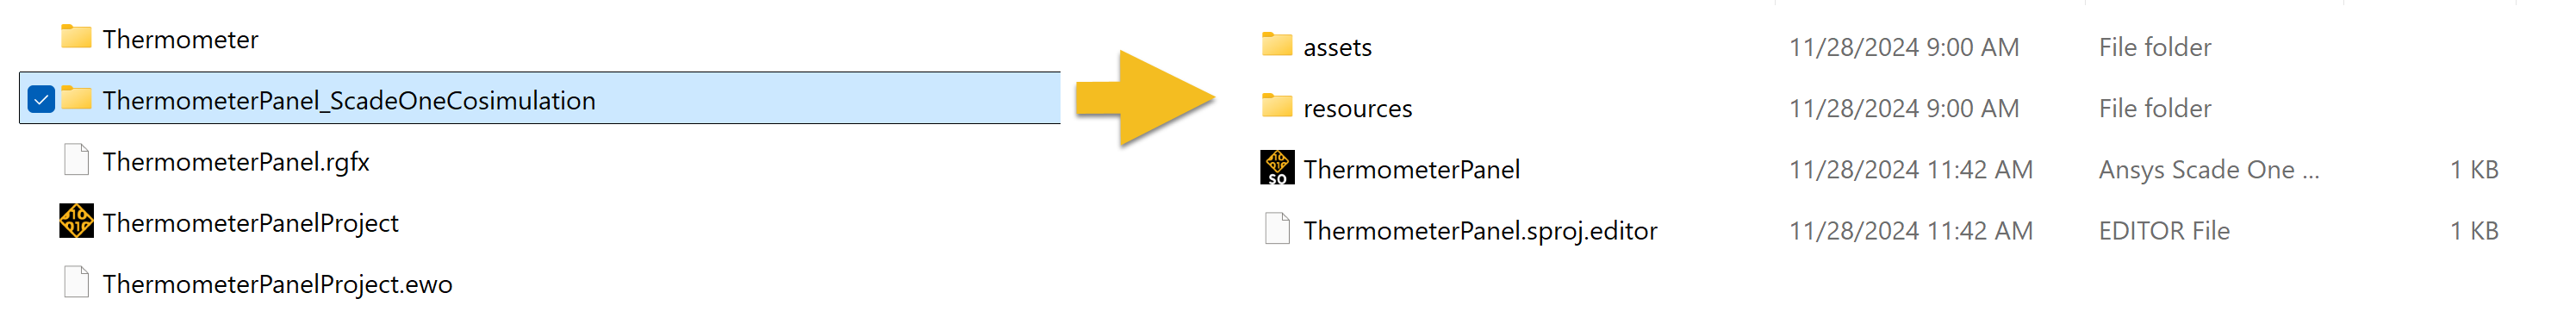
- ThermometerPanel.sproj: the Scade One project to be referenced in Thermometer project
- ThermometerPanel.swan: the Scade One operator defining the panel’s inputs/outputs
- ThermometerPanel.spanel: the graphical panel that we’ll use to drive a model execution in Scade One
Our panel is ready. We can go to the Scade One tool to connect the panel with the Thermometer model!
Execute a Scade One Model with a Graphical Panel
The Thermometer project is located in the following Scade One installation folder: \examples\GettingStarted\MyFirstModelWithSOne\Dependency. We copy this project into a working directory, as well as the files generated by the Rapid Prototyper (the ThermometerPanel_ScadeOneCosimulation folder).
Let’s launch the Scade One application and open the Thermometer project. We need to add the generated ThermometerPanel project to the workspace and define it as a dependency of the Thermometer project.
To connect the panel to the Thermometer model, we will add:
- a new test harness, a particular operator that defines a model-based test scenario, into the TestModule named: TH_ThermPanelToFahrenheit
- a use directive, to allow to reference declarations in another module, to the TestModule: use ThermometerPanel
The test harness consists of:
- Instances of ThermometerPanel and ToFahrenheit operators
- A Definition block from the Catalog, to visualize the model output (optional, the model output can be visualized during model execution by opening ToFahrenheit operator)
- Wires named according to corresponding flows: tempCelsius, tempC, tempF
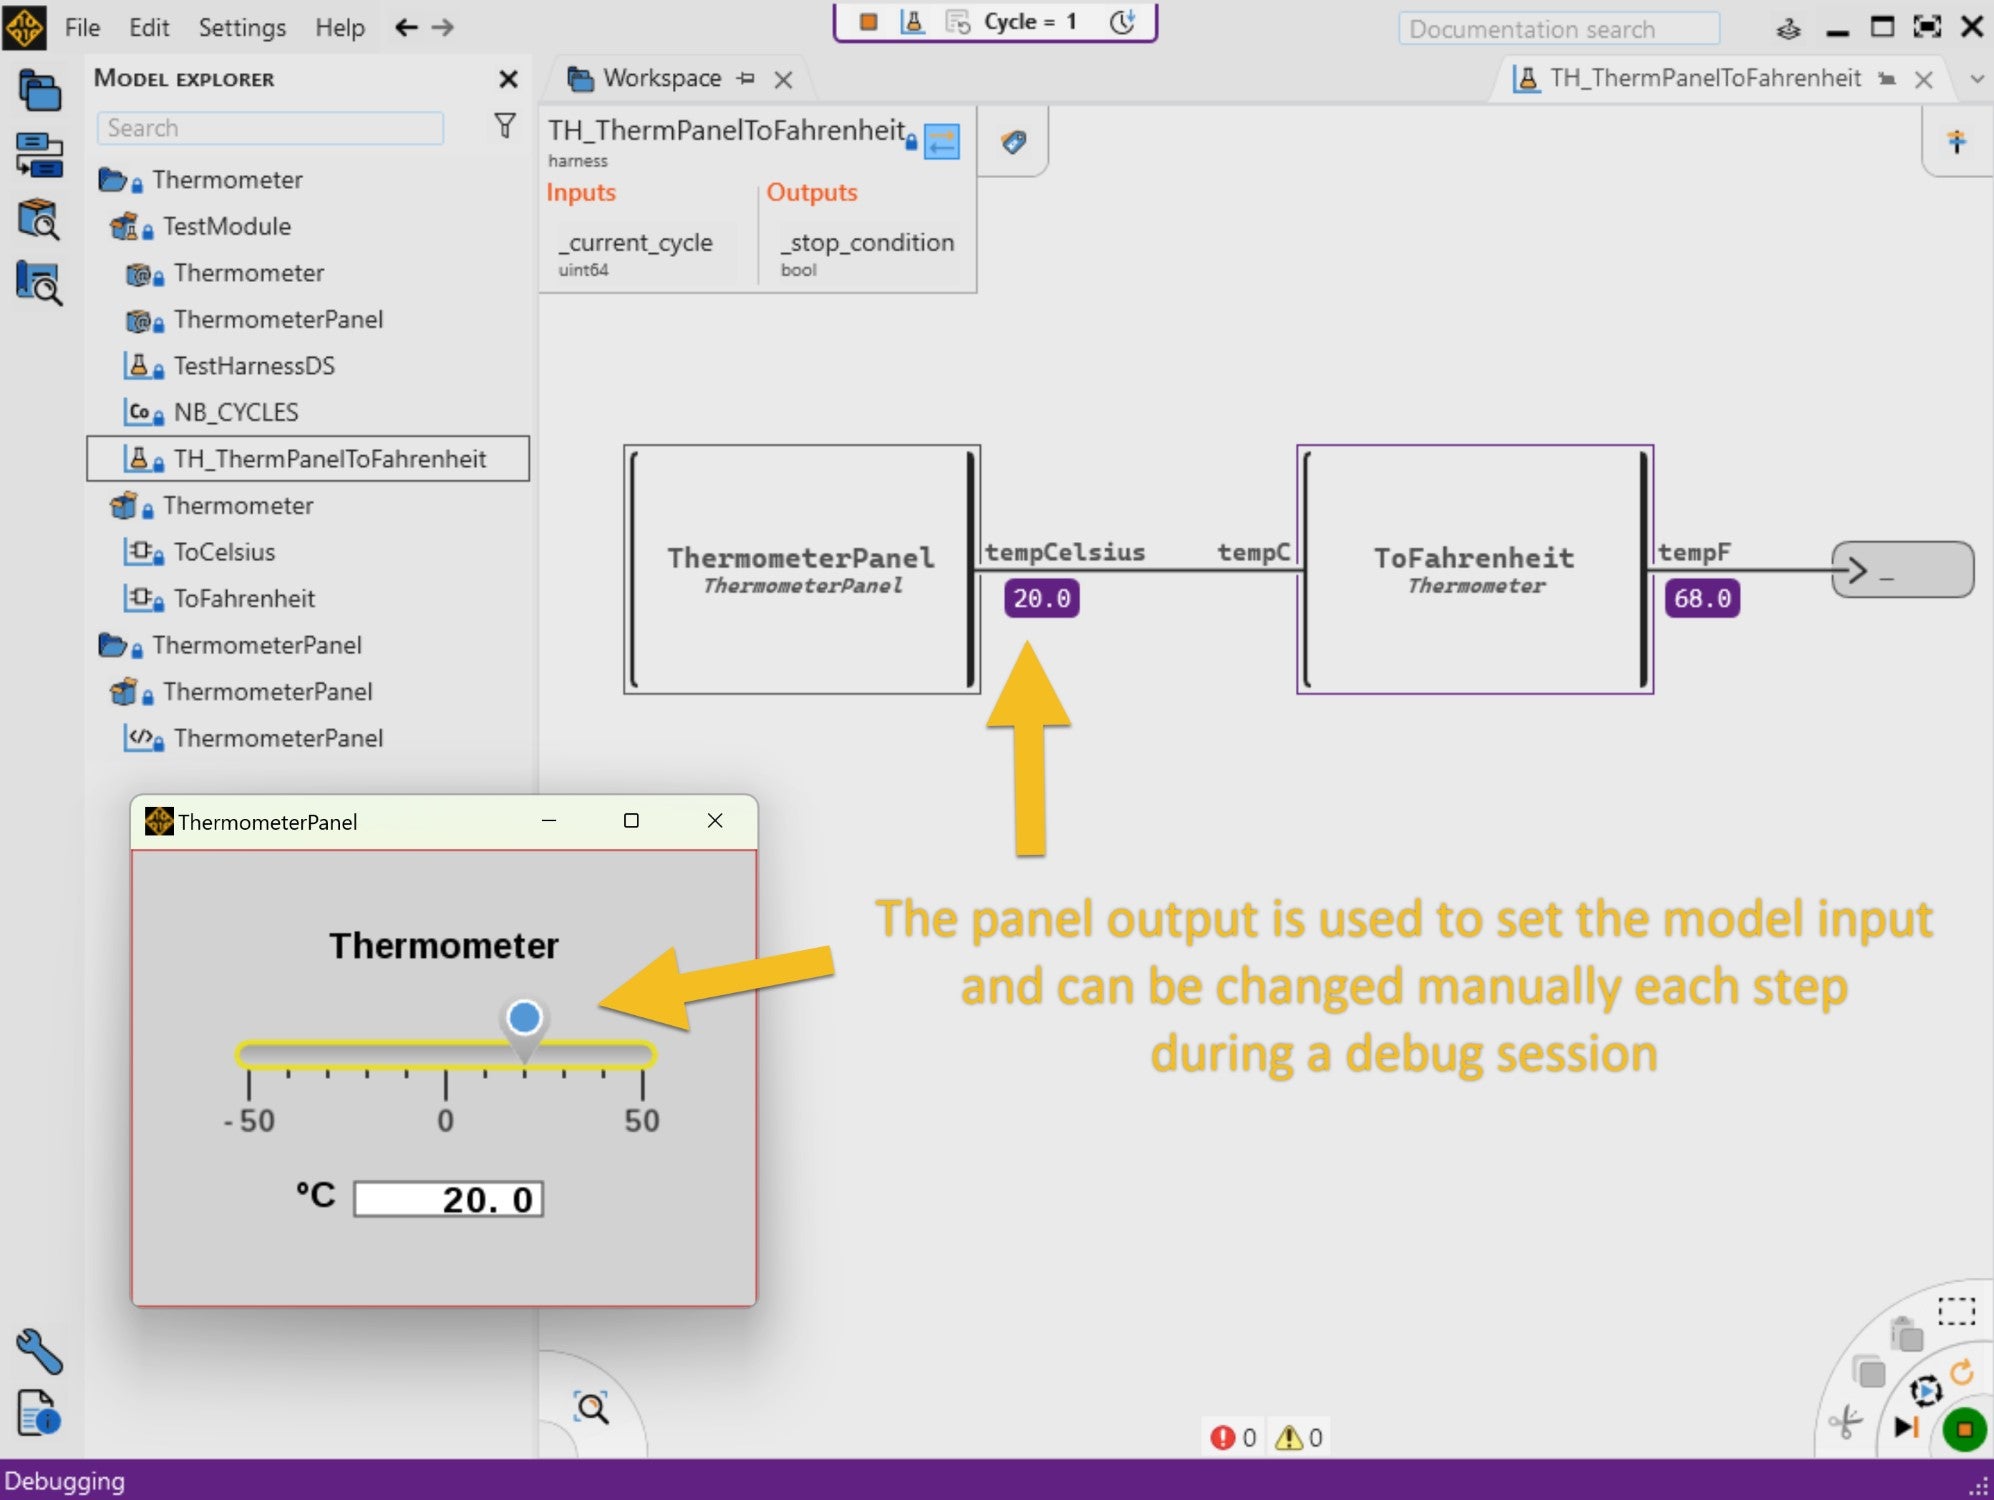
We add and connect all the listed blocks in test harness TH_ThermPanelToFahrenheit, as shown on the first figure in the Introduction section.
Now our model is ready to be executed. We can start a debug session and set the input temperature to 25°C using the panel. The panel input will be applied to the model at the next step. We click “Step” to execute one step and visualize the values on the different wires. We can check that the output temperature is equal to 77°F.
We can also observe the results live, in continuous mode and by moving the slider.
Next Steps
In this article, we saw how to create graphical panels with Rapid Prototyper and leverage them to debug and simulate control software models in the Scade One environment.
SCADE Rapid Prototyper 2025 R1 is bundled with Scade One Studio. If you have a Scade One license and wish to experiment, you may download this article’s example model here (or browse its sources).
For more details about the Rapid Prototyper tool, you may consult the SCADE Rapid Prototyper User Manual and Getting Started with SCADE Rapid Prototyper, located in the SCADE online documentation. Furthermore, a training on the Ansys SCADE Test environment and the Rapid Prototyper tool is available at Introduction to Ansys SCADE Rapid Prototyper.
If you wish to learn more about Scade One, consult sections My First Steps in Scade One Tool and Executing and Debugging Models with Graphical Panels in the Scade One online documentation.
About the author
|

|
Elena Ivanova (LinkedIn) is a Senior R&D Documentation Specialist. She joined Ansys in 2024 and works on the Scade One product. She has a PhD in Control Theory and about 10 years of experience in automotive and aeronautics.
|