- All Categories
- Fluids - Postprocessing
- How can I hide the legend or colormap for a Fluent plot?
Tagged: ansys-fluent, contour plot
-
-
June 6, 2022 at 8:33 am
 FAQParticipant
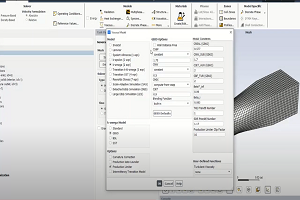
To hide the legend or colormap for a Fluent plot,, do the following steps:
1. Go to the View tab, and click on Options …
2. On the right hand side of the form that comes up, uncheck the box next to Colormap
3. Click Apply
-


Introducing Ansys Electronics Desktop on Ansys Cloud
The Watch & Learn video article provides an overview of cloud computing from Electronics Desktop and details the product licenses and subscriptions to ANSYS Cloud Service that are...

How to Create a Reflector for a Center High-Mounted Stop Lamp (CHMSL)
This video article demonstrates how to create a reflector for a center high-mounted stop lamp. Optical Part design in Ansys SPEOS enables the design and validation of multiple...

Introducing the GEKO Turbulence Model in Ansys Fluent
The GEKO (GEneralized K-Omega) turbulence model offers a flexible, robust, general-purpose approach to RANS turbulence modeling. Introducing 2 videos: Part 1 provides background information on the model and a...

Postprocessing on Ansys EnSight
This video demonstrates exporting data from Fluent in EnSight Case Gold format, and it reviews the basic postprocessing capabilities of EnSight.

- ANSYS Fluent: Scene and Animation Creation
- ANSYS Fluent: Simulation of a Rotating Propeller – Part 2
- Display Multiple Plots in the Same Scene using Overlays in Fluent
- Use Different Modes for Saving Pictures in Fluent
- Creating a User Surface in ANSYS CFD Post-processing
- ANSYS EnSight: Overview of Postprocessing a Fluent Case in EnSight
- Add Annotation to Graphics Display within Fluent
- How do I automatically export figures generated in CFD-Post from Workbench?
- ANSYS CFX: User Locations in Transient Simulations
- How can I hide the legend or colormap for a Fluent plot?

© 2025 Copyright ANSYS, Inc. All rights reserved.

