-
-
November 2, 2022 at 9:16 am
 Watch & LearnParticipant
In this video quick tip, we will see how you can visual and probe the results in Discovery contour plots. While post processing, if you hover your mouse over the any result region in Discovery, you can see the value at that location highlighted in the legend.
-


Introducing Ansys Electronics Desktop on Ansys Cloud
The Watch & Learn video article provides an overview of cloud computing from Electronics Desktop and details the product licenses and subscriptions to ANSYS Cloud Service that are...

How to Create a Reflector for a Center High-Mounted Stop Lamp (CHMSL)
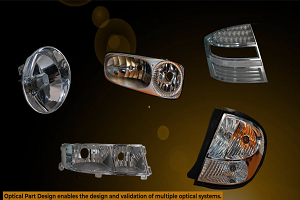
This video article demonstrates how to create a reflector for a center high-mounted stop lamp. Optical Part design in Ansys SPEOS enables the design and validation of multiple...

Introducing the GEKO Turbulence Model in Ansys Fluent
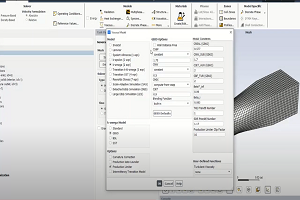
The GEKO (GEneralized K-Omega) turbulence model offers a flexible, robust, general-purpose approach to RANS turbulence modeling. Introducing 2 videos: Part 1 provides background information on the model and a...

Postprocessing on Ansys EnSight
This video demonstrates exporting data from Fluent in EnSight Case Gold format, and it reviews the basic postprocessing capabilities of EnSight.

- In-Depth – Fluids Simulation using Ansys Discovery
- Discovery: Porous media coefficient calculator
- Ansys Discovery: Topology Optimization
- Structural Simulation using Bolt Idealization
- Thermal Analysis of Heat Sinks with Ansys Discovery
- Ansys Discovery- Intake and Exhaust Fan for Fluids
- Discovery – Defining new material
- How to apply bolt Pretension in ANSYS Discovery?
- Discovery Explore: How to retain a certain portion of the geometry in topology optimization?
- Ansys Discovery: Activating Beta Feature

© 2025 Copyright ANSYS, Inc. All rights reserved.

