- All Categories
- Fluids - Postprocessing
- Can Forte be used to provide wall heat transfer boundary condition data mapping for a larger Fluent (or other CFD) simulation? What sort of output should I set up for my Forte Solution to achieve this?
Can Forte be used to provide wall heat transfer boundary condition data mapping for a larger Fluent (or other CFD) simulation? What sort of output should I set up for my Forte Solution to achieve this?
Tagged: 19.2, fluid-dynamics, Forte, Other, post-processing
-
-
August 25, 2023 at 12:16 pm
 SolutionParticipant
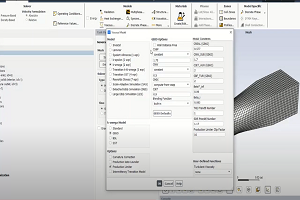
This can be done in Forte under Output Controls> Monitor Probes. image1.png To start, Create a new monitor probe and set the location to Wall Sampling. Wall Sampling monitor probes can be used to specify points or point clouds at which data is collected over a specified time interval. There are two options for specifying points. The recommended Point Cloud Specification is “Generate from Surface”. This option allows the point cloud to be extracted directly from the surface mesh nodes. The point cloud will always collocate with the surface mesh nodes. When the surface is static, the point cloud is static; when the surface moves, the point cloud moves with it automatically. This option is convenient to use and requires very little user intervention, but the drawback is that the point cloud’s resolution is set by the surface mesh. (The data that is extracted can be filtered in Excel, however.) The other option is called “Specify Points”. This option allows the user to explicitly define the coordinates of the point cloud in a table editor. If the points are expected to move with a surface, user must select the additional option “Attach to Moving Wall”, and select a boundary condition corresponding to it. In this way, the point cloud will follow the motion of the surface as prescribed in the boundary condition. This option is less straightforward and requires user’s own efforts to come up with the points’ coordinates. Three output variables are available for Wall Sampling probes: heat transfer flux, heat transfer coefficient, and near-wall gas temperature. The probe works by time-averaging these solution variables over the Time or Crank Angle (CA) interval for which the probe is active. Instantaneous data over several different crank angle or time intervals requires copies of the same point cloud, with each copy active over a different CA interval. For example, one may set up the following wall-sampling probes: Probe1_at_100_CAdeg: same point cloud, actively only between CA=99 to 101 deg; Probe2_at_200_CAdeg: same point cloud, actively only between CA=199 to 201 deg; Probe3_at_300_CAdeg: same point cloud, actively only between CA=299 to 301 deg; Each wall-sampling probe produces two .csv output files. In each file, the points’ coordinates and inquired variables are given. The following shows an example of the first file, which contains the output data image2.png The “effective inquiry time” is a default output, showing the effective duration of time-averaging when the local probe point is considered “active”, i.e., in touch with in-cylinder gas rather than sealed by metal surface. The second output file contains additional output of point connectivity information, indicating how the probe points form the surface mesh (if the point cloud is generated from the surface mesh). This section of data is helpful when visualize the output file in CFD-Post.and can be read into CFD-Post directly as a user-defined surface. image3.png PLEASE NOTE: As mentioned, the Probe output format is (x, y, z, heatflux), which can be modified to Fluent profile format. …… Future releases of Forte will allow a single Probe definition to output instantaneous data several different intervals.
Attachments:
1. image2.png
2. image3.png
-


Introducing Ansys Electronics Desktop on Ansys Cloud
The Watch & Learn video article provides an overview of cloud computing from Electronics Desktop and details the product licenses and subscriptions to ANSYS Cloud Service that are...

How to Create a Reflector for a Center High-Mounted Stop Lamp (CHMSL)
This video article demonstrates how to create a reflector for a center high-mounted stop lamp. Optical Part design in Ansys SPEOS enables the design and validation of multiple...

Introducing the GEKO Turbulence Model in Ansys Fluent
The GEKO (GEneralized K-Omega) turbulence model offers a flexible, robust, general-purpose approach to RANS turbulence modeling. Introducing 2 videos: Part 1 provides background information on the model and a...

Postprocessing on Ansys EnSight
This video demonstrates exporting data from Fluent in EnSight Case Gold format, and it reviews the basic postprocessing capabilities of EnSight.

- ANSYS EnSight: Overview of Postprocessing a Fluent Case in EnSight
- ANSYS Fluent: Scene and Animation Creation
- ANSYS Fluent: Simulation of a Rotating Propeller – Part 2
- Display Multiple Plots in the Same Scene using Overlays in Fluent
- Use Different Modes for Saving Pictures in Fluent
- Creating a User Surface in ANSYS CFD Post-processing
- Add Annotation to Graphics Display within Fluent
- How can I hide the legend or colormap for a Fluent plot?
- How do I automatically export figures generated in CFD-Post from Workbench?
- How do I display a vector or contour and the mesh lines together via TUI command?

© 2025 Copyright ANSYS, Inc. All rights reserved.

