-
-
July 3, 2024 at 10:06 am
Isoth Madush
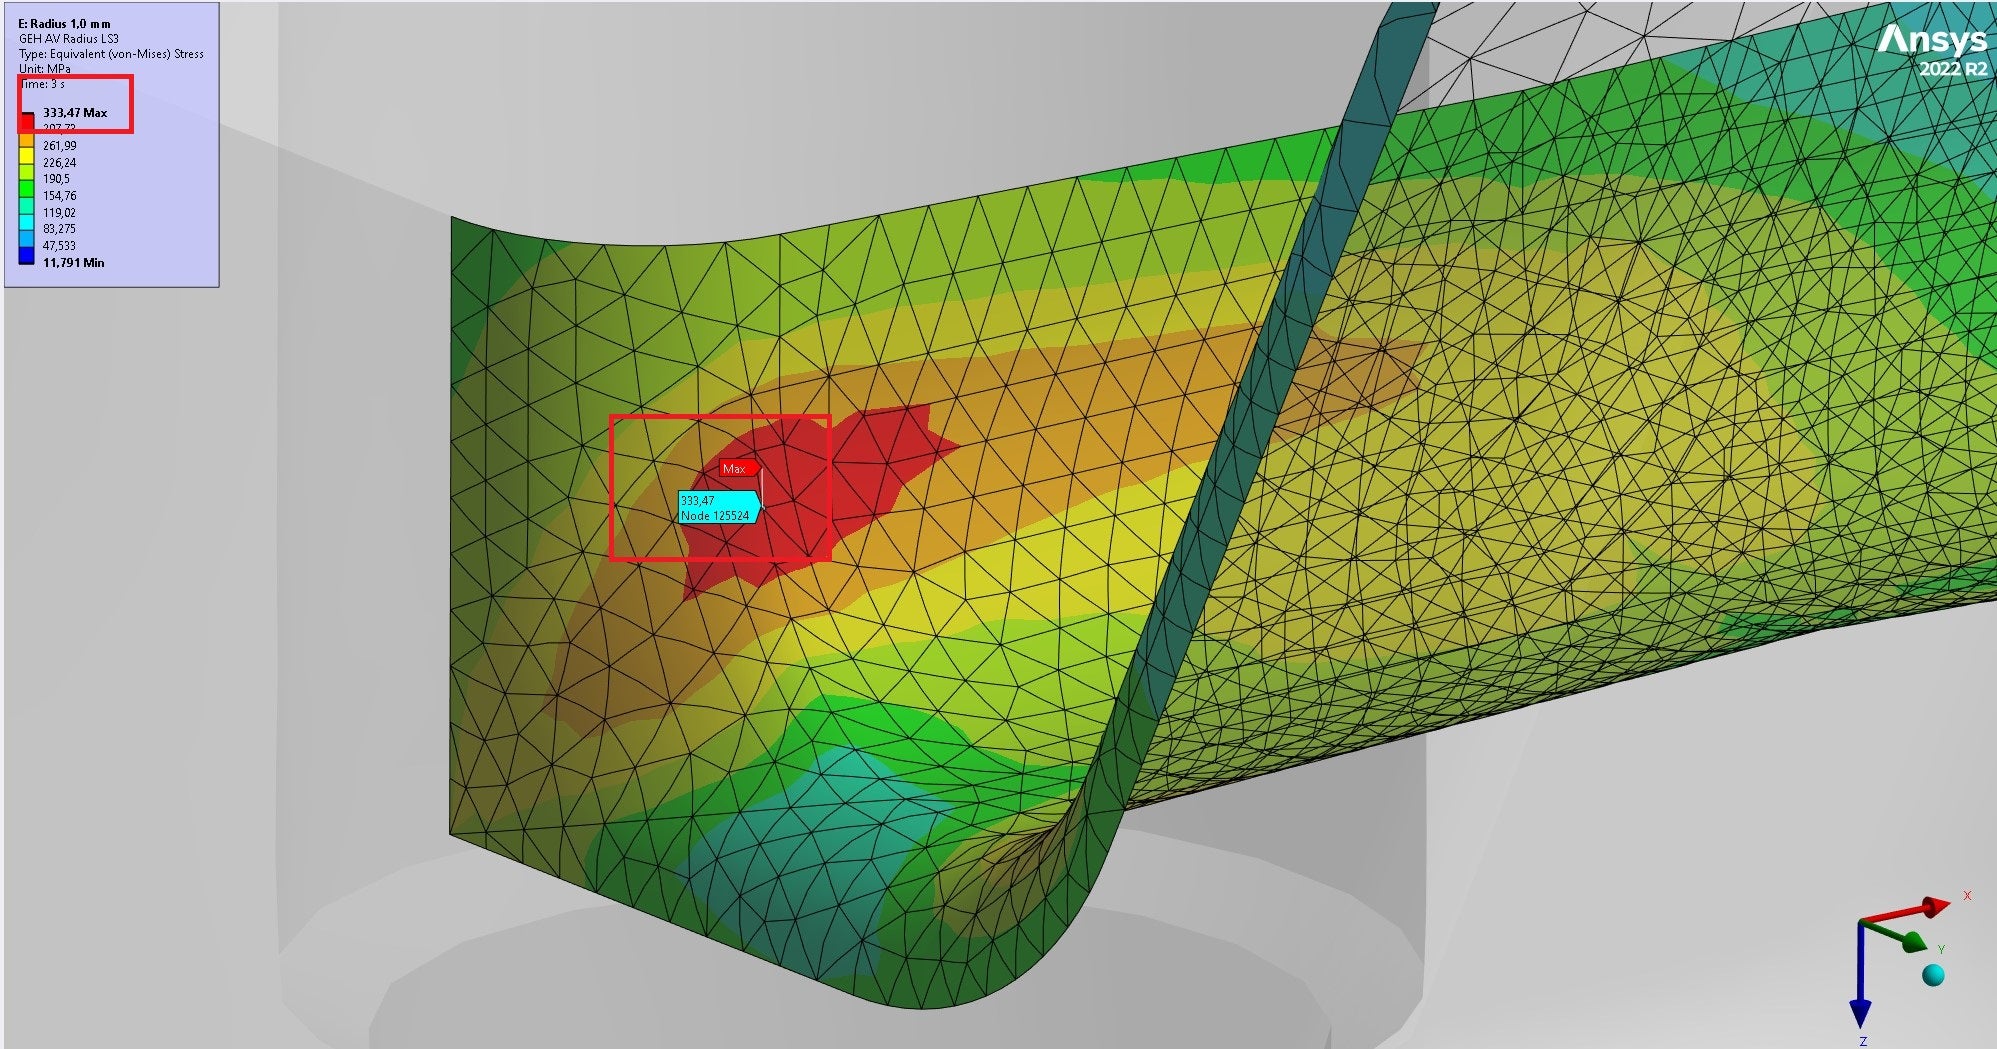
SubscriberI have the problem that the stress value (max. stress according to Mises) at the surface (Fig. 1, 334.47 MPa) does not match the evaluation of a path (Fig. 2, 343.33 MPa). The start of the path is at the same node as in Fig. 1 and extends vertically 10 mm into the component. 100 points along the path are considered. Furthermore, the course of the gradient within the first support points is strange. Both stresses are according to Mises, and the loadstep also matches.
It would be nice if you could help me. Thank you very much!
-
July 5, 2024 at 3:39 pm
danielshaw
Ansys EmployeeDid you try plotting the unaveraged Seqv?
-
Viewing 1 reply thread
- The topic ‘Wrong Stress Gradient’ is closed to new replies.
Ansys Innovation Space


Trending discussions


Top Contributors


-
3492
-
1057
-
1051
-
965
-
942
Top Rated Tags


© 2025 Copyright ANSYS, Inc. All rights reserved.
Ansys does not support the usage of unauthorized Ansys software. Please visit www.ansys.com to obtain an official distribution.


