TAGGED: nodes, thermal-analysis, vertex
-
-
August 28, 2024 at 4:55 pm
-
August 29, 2024 at 1:15 pm
Govindan Nagappan
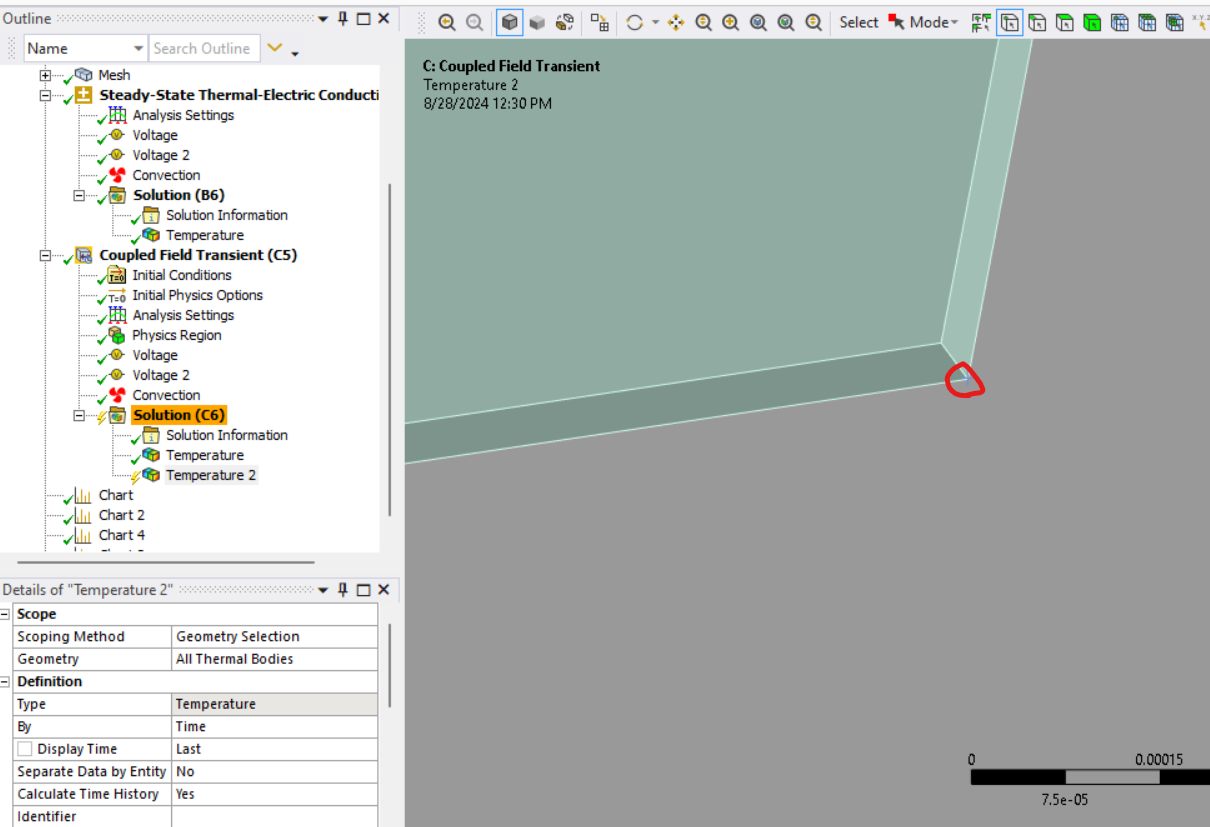
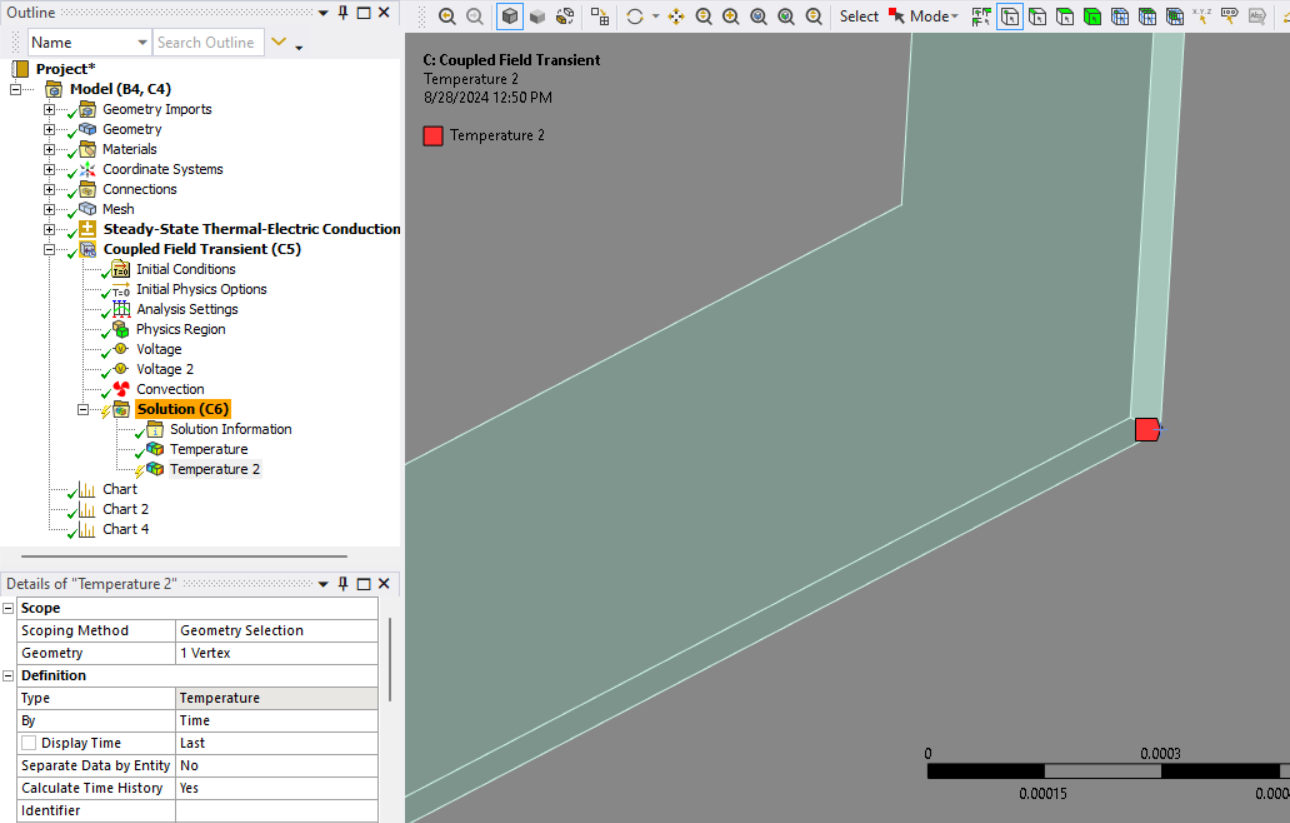
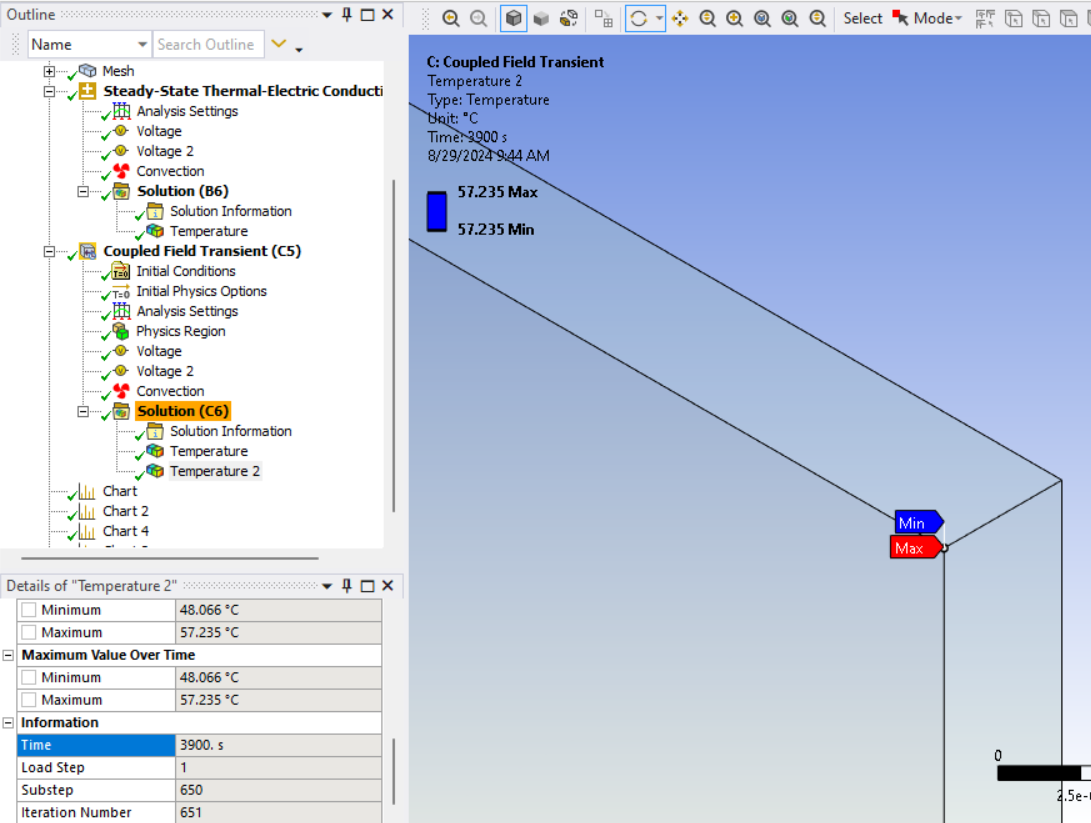
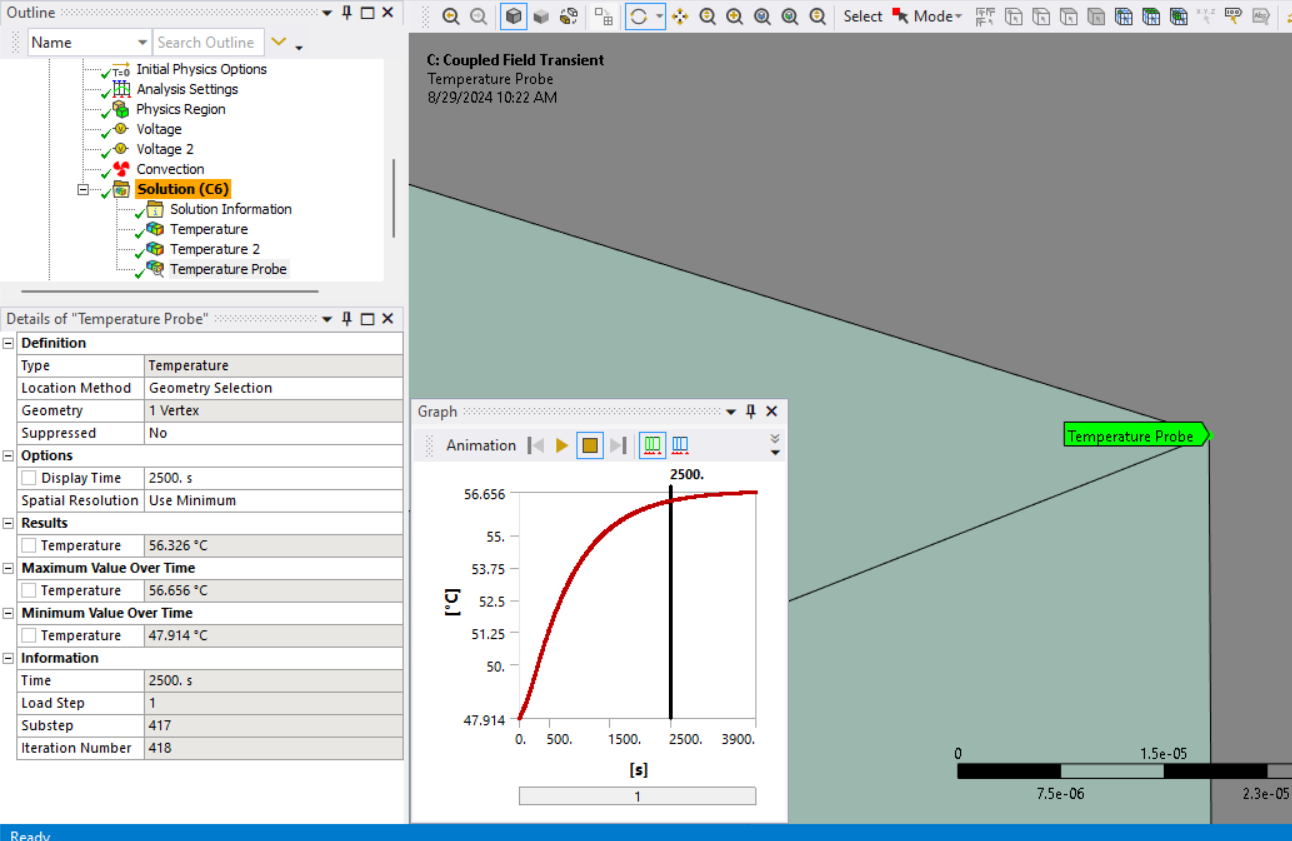
Ansys EmployeeAt a vertex, you have only one value for temperature at selected time. So same value is used for max and min display
If you plot result on a surface or an edge, then you have results from all nodes on the surface/edge. So, there is possibility that the temperature could be different on different nodes and so you will have a different max and min values
-
August 29, 2024 at 1:49 pm
jdidd1
SubscriberThis is the result it showing is there any other possibilites
-
-
August 29, 2024 at 1:31 pm
jdidd1
SubscriberThank you for your reply
Yes, I understand, the surface and edge are showing the result. But I want it at a random node, is there any other way to solve this I mean to get the maxi and mini values?
I also included the time for the 25mins it should show the maxi and mini values because of the transient analysis
-
August 29, 2024 at 1:45 pm
-
August 29, 2024 at 1:49 pm
-
August 29, 2024 at 1:58 pm
Govindan Nagappan
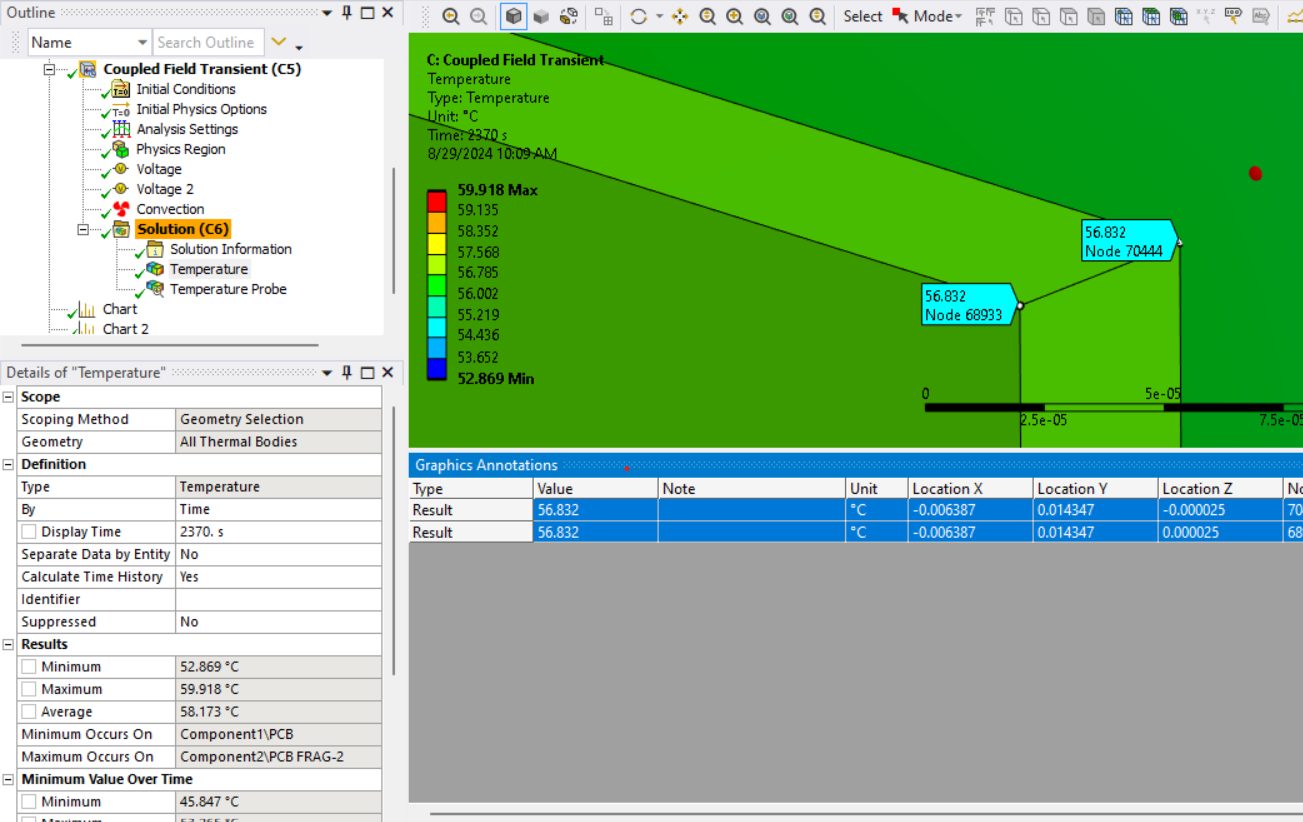
Ansys EmployeeInsert a probe on the vertex. RIght click on solution and insert Probe - temperature
-
August 29, 2024 at 2:14 pm
-
-
August 29, 2024 at 2:11 pm
-
August 29, 2024 at 2:20 pm
Govindan Nagappan
Ansys Employeeyou get the graph when you plot result at the vertex. You image shows result on bodies
-
August 29, 2024 at 2:27 pm
-
-
- You must be logged in to reply to this topic.


-
3367
-
1050
-
1047
-
886
-
831

© 2025 Copyright ANSYS, Inc. All rights reserved.

