

-
-
October 1, 2021 at 1:48 pm
mrteo
SubscriberHi,
I am doing a thesis on the spread of covid19 and I would you like to track the number of particles vs the distance the particles have traveled.
I exported my fluent particle tracking data to the CFD post.
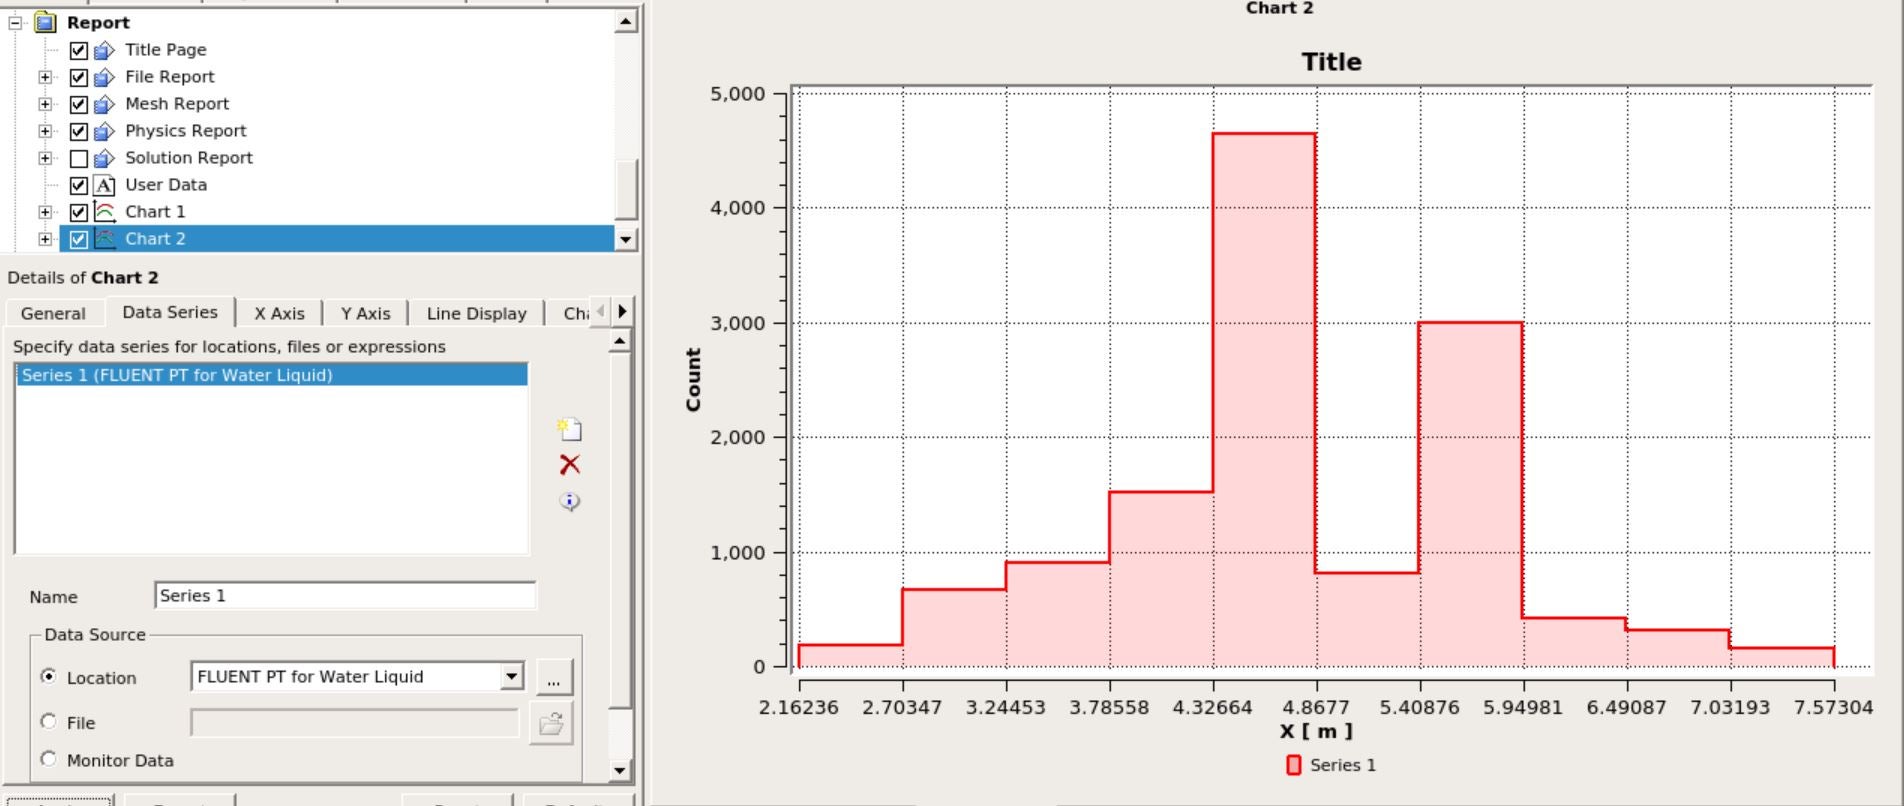
When I plotted a chart using histogram, where the x-axis is defined as X and the y-axis as count. Its like the image as shown. The data series used was the particle tracking data as location.
What does this count mean?
Hope someone could answer my query!
October 4, 2021 at 9:09 pmSurya Deb
Ansys EmployeeHello,
It should be the number of parcels. Check it with histogram from Fluent as well.
Regards SD
Viewing 1 reply thread- The topic ‘What does the count mean in the CFD post?’ is closed to new replies.
Innovation Space Trending discussions
 Top Contributors
-
peteroznewman
 4728
4728 -
scabo
 1565
1565 -
Dennis Chen
 1386
1386 -
javat33489
 1242
1242 -
Shyam Prasad V Atri
1021
Top Rated Tags
© 2026 Copyright ANSYS, Inc. All rights reserved.
Ansys does not support the usage of unauthorized Ansys software. Please visit www.ansys.com to obtain an official distribution.
-


The Ansys Learning Forum is a public forum. You are prohibited from providing (i) information that is confidential to You, your employer, or any third party, (ii) Personal Data or individually identifiable health information, (iii) any information that is U.S. Government Classified, Controlled Unclassified Information, International Traffic in Arms Regulators (ITAR) or Export Administration Regulators (EAR) controlled or otherwise have been determined by the United States Government or by a foreign government to require protection against unauthorized disclosure for reasons of national security, or (iv) topics or information restricted by the People's Republic of China data protection and privacy laws.


