TAGGED: frequency-domain, photonics
-
-
November 7, 2024 at 3:23 pm
pm796
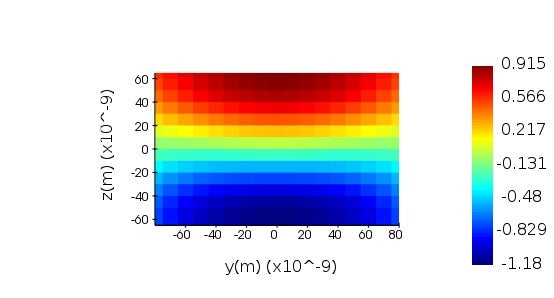
SubscriberThe reference manual section on the Frequency-domain Profile and Power monitor somehow manages to avoid actually stating what results the monitor gives! Is anyone able to clarify? I can see that it splits up the results into separate components for each frequency (and you can view them by using the slider at the bottom right), and you can view results relating to 'E', 'H' and the poynting vector - but it is not clear what the results being displayed (in the image below for example, in which the colour scale has no description or units labelled...) actually are. For example, if it is the E field, how is that useful since the E field will be rapidly oscillating in time (being a wave...)?
Thanks for your help!
-
November 8, 2024 at 7:26 pm
Kirill
Forum ModeratorHello pm796,
The Frequency-Domain Profile and Power Monitor provides frequency-domain representations of electromagnetic fields and power, focusing on steady-state field amplitudes and intensities rather than time-dependent oscillations. It captures spatially varying complex amplitudes (both magnitude and phase) of the field, obtained via Fourier transform from the time-domain field.
When observing the E- or H-component in the monitor, you're viewing the field's magnitude (along with a few other basic scalar operations) at a specific frequency — not a snapshot in time. This capability to analyze specific frequencies (using the slider) allows for examining the spectral response of your structure. For instance, you can see how fields or power vary across wavelengths to explore resonance or identify optimal operating frequencies.
For a better understanding of this monitor, please refer to the article: Understanding frequency domain CW normalization.
Best regards,
Kirill
-
- You must be logged in to reply to this topic.


-
3472
-
1057
-
1051
-
929
-
896

© 2025 Copyright ANSYS, Inc. All rights reserved.


