-
-
May 14, 2024 at 8:38 am
Logeshwaran Venkatesapandian
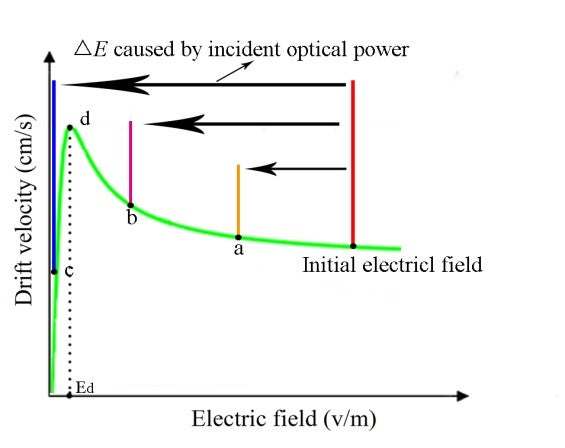
SubscriberThank you very much for your response. we figure out that there is an optical power screening effect at a higher optical generation rate. In that case, the Electric field is reduced and the saturation velocity (Vsat) of photo generated carrier is reduced.
So, we want to plot Drift velocity vs Electric field to extract the saturation velocity to check this effect. Can you please tell me how we can do that? As shown in the below referred graph. please help us with a solution to plot this. Thank you.
-
May 15, 2024 at 6:44 pm
Amrita Pati
Ansys EmployeeHi Logeshwaran,
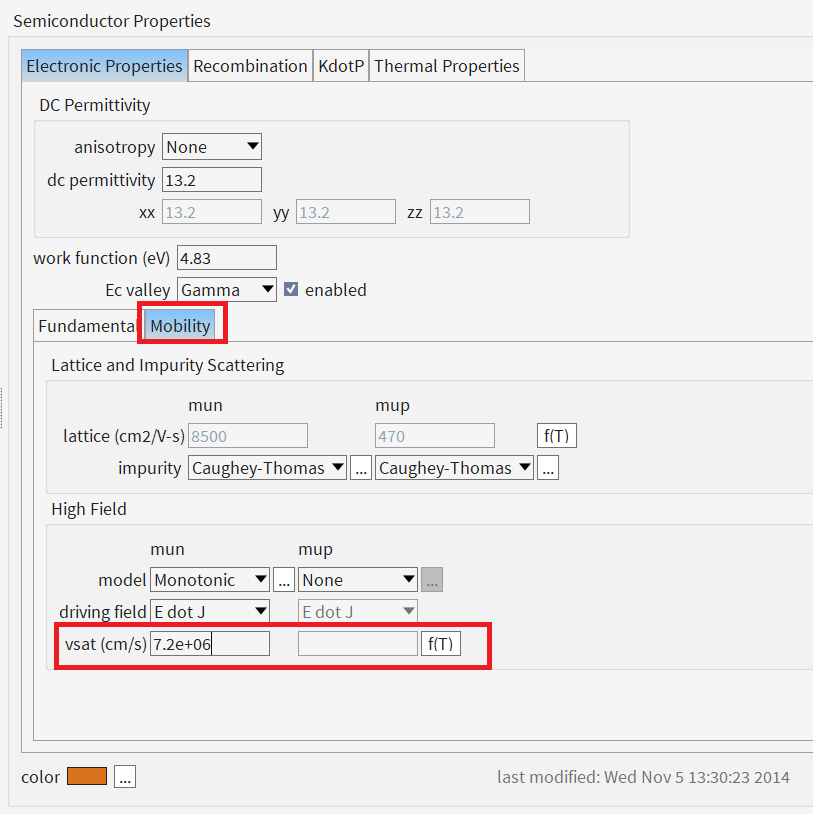
My understanding is that when the electric field increases, the drift-velocity of the carriers is commonly observed to saturate, reducing the mobility accordingly. To account for this effect, CHARGE includes high-field mobility models that describe the monotonic (silicon-like) or overshoot (GaAs-like) velocity saturation behaviour. So, the saturation velocity can be set as a parameter by the user:

I am not sure if the saturation velocity is something that can be modeled. I have reached out to my colleague to confirm this. I will get back to you.
Regards,
Amrita -
May 15, 2024 at 7:15 pm
Amrita Pati
Ansys EmployeeHi Logeshwaran,
I confirmed this with my colleague as well. You can enable the High-Field Mobility Model, to include the saturation velocity as a parameter to simulate the saturation effects on mobility (and drift current) vs field. But you won't be able to directly model the saturation velocity itself.
You may find more information on the high-field mobility here: Semiconductor Material Model Properties .
Regards,
Amrita
-
- The topic ‘we want to plot Drift velocity vs Electric field’ is closed to new replies.


-
2778
-
965
-
841
-
599
-
591

© 2025 Copyright ANSYS, Inc. All rights reserved.


