
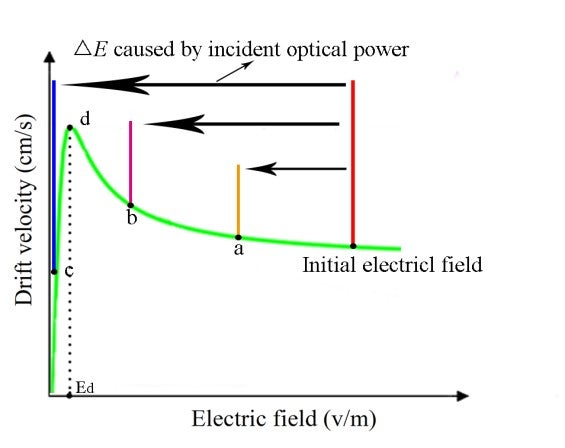
we want to plot Drift velocity vs Electric field


Viewing 2 reply threads
- The topic ‘we want to plot Drift velocity vs Electric field’ is closed to new replies.


