TAGGED: Discovery Live, fluids
-
-
August 21, 2020 at 10:33 am
tim.dukes
Subscriber
Hi Support,
Could you look into the following. I have attached 2 files which show very different results in 2109R3 and 2020R1 and R2.
Any reason why there is such variation in the versions. The parts aren't complex. Which is correct?
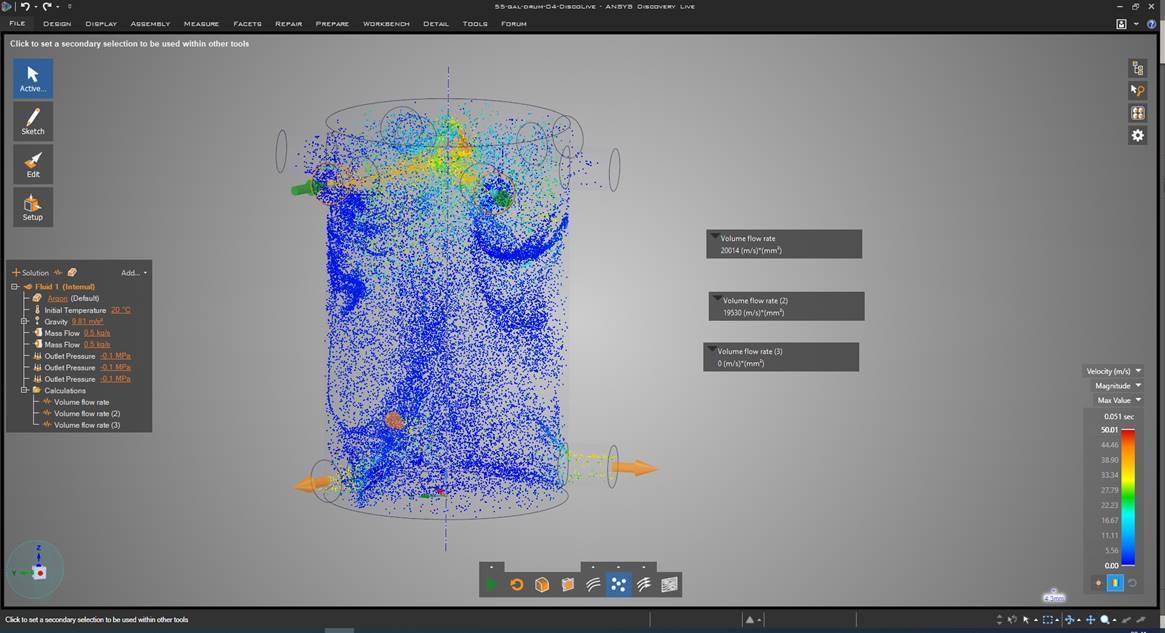
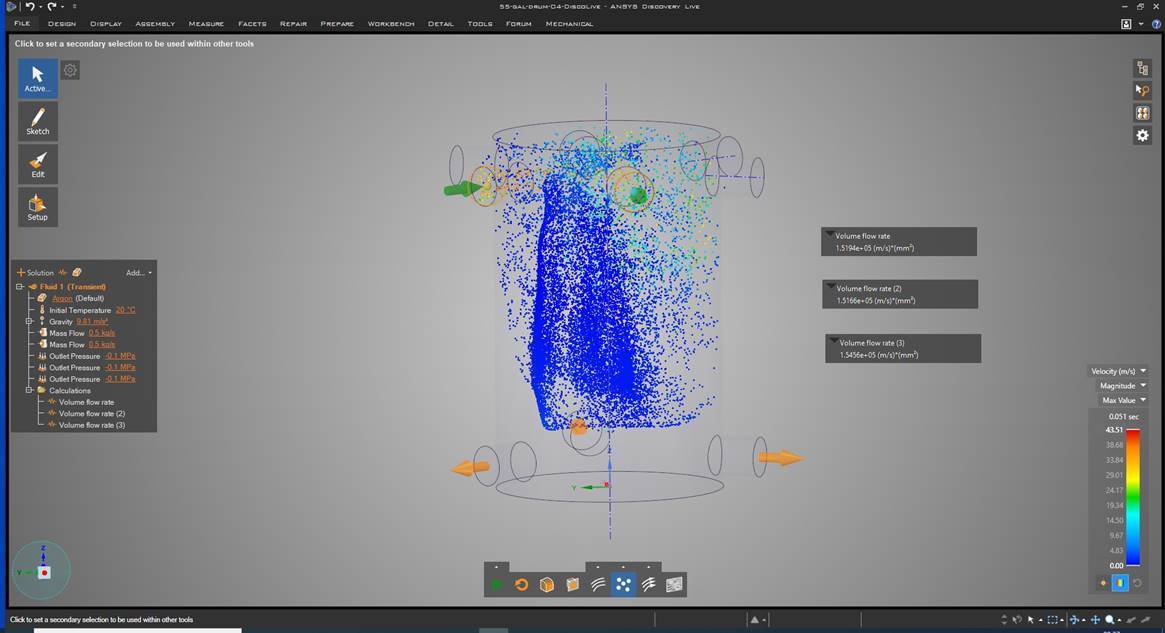
The first is volume flow rate
2019 R3 (In this the volume flow rate isn't being calculated for one of the outlets not sure why)
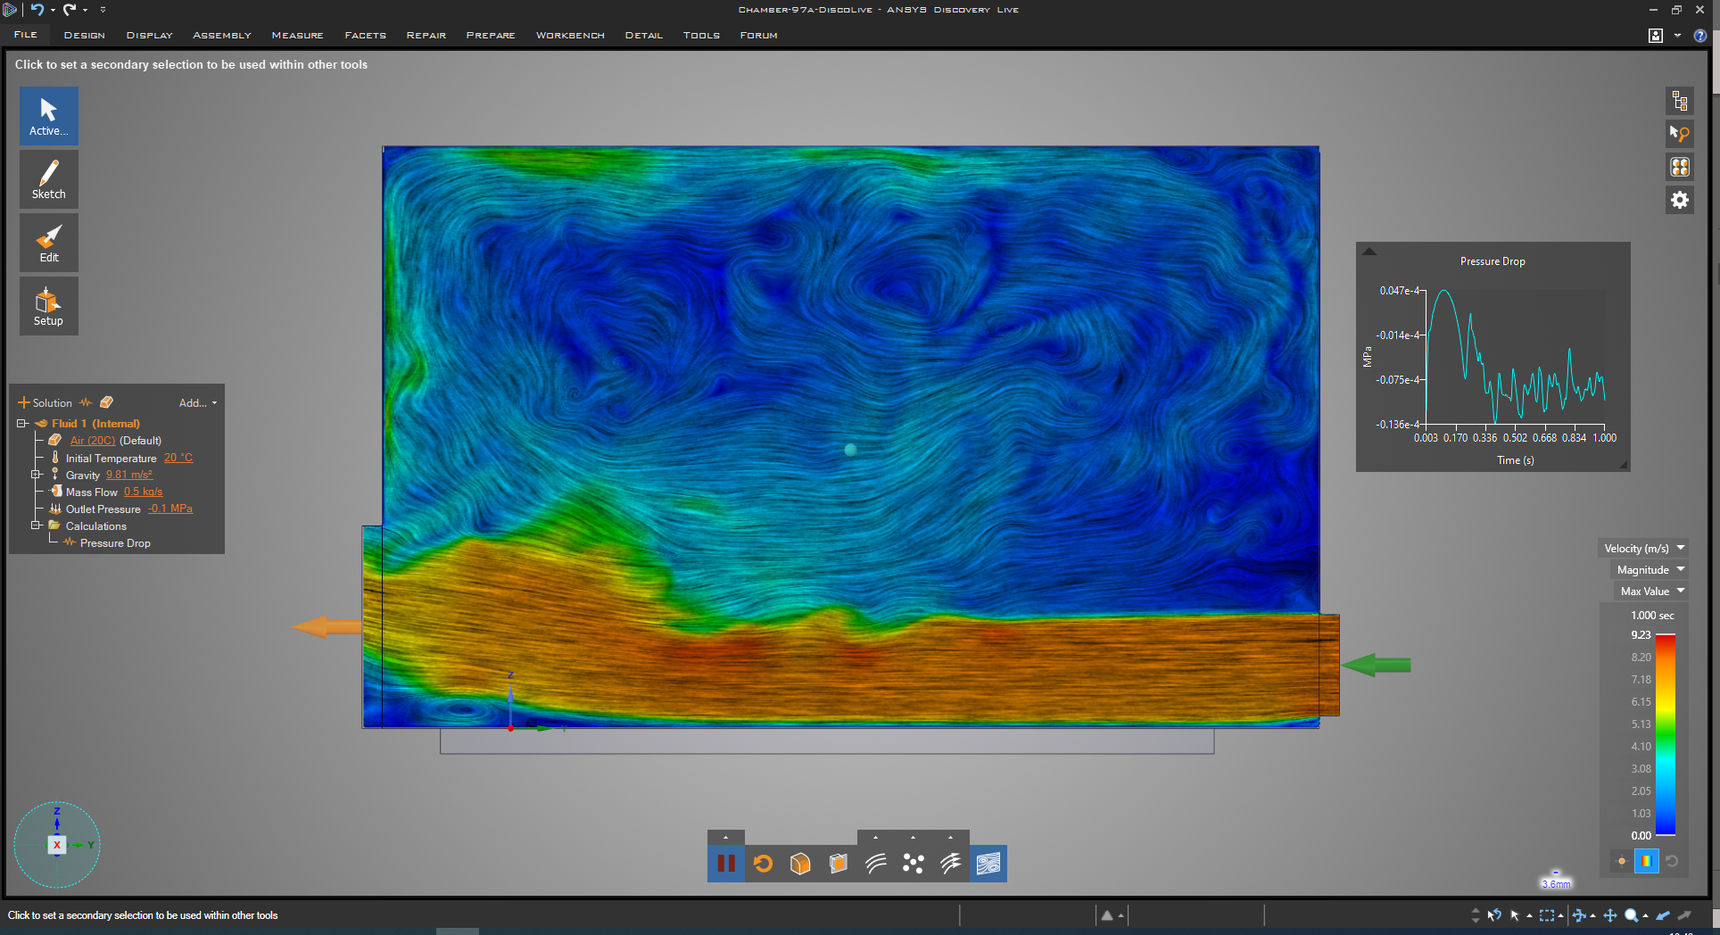
The second is Pressure Drop
2019 R3 PD = -1.0437e-05
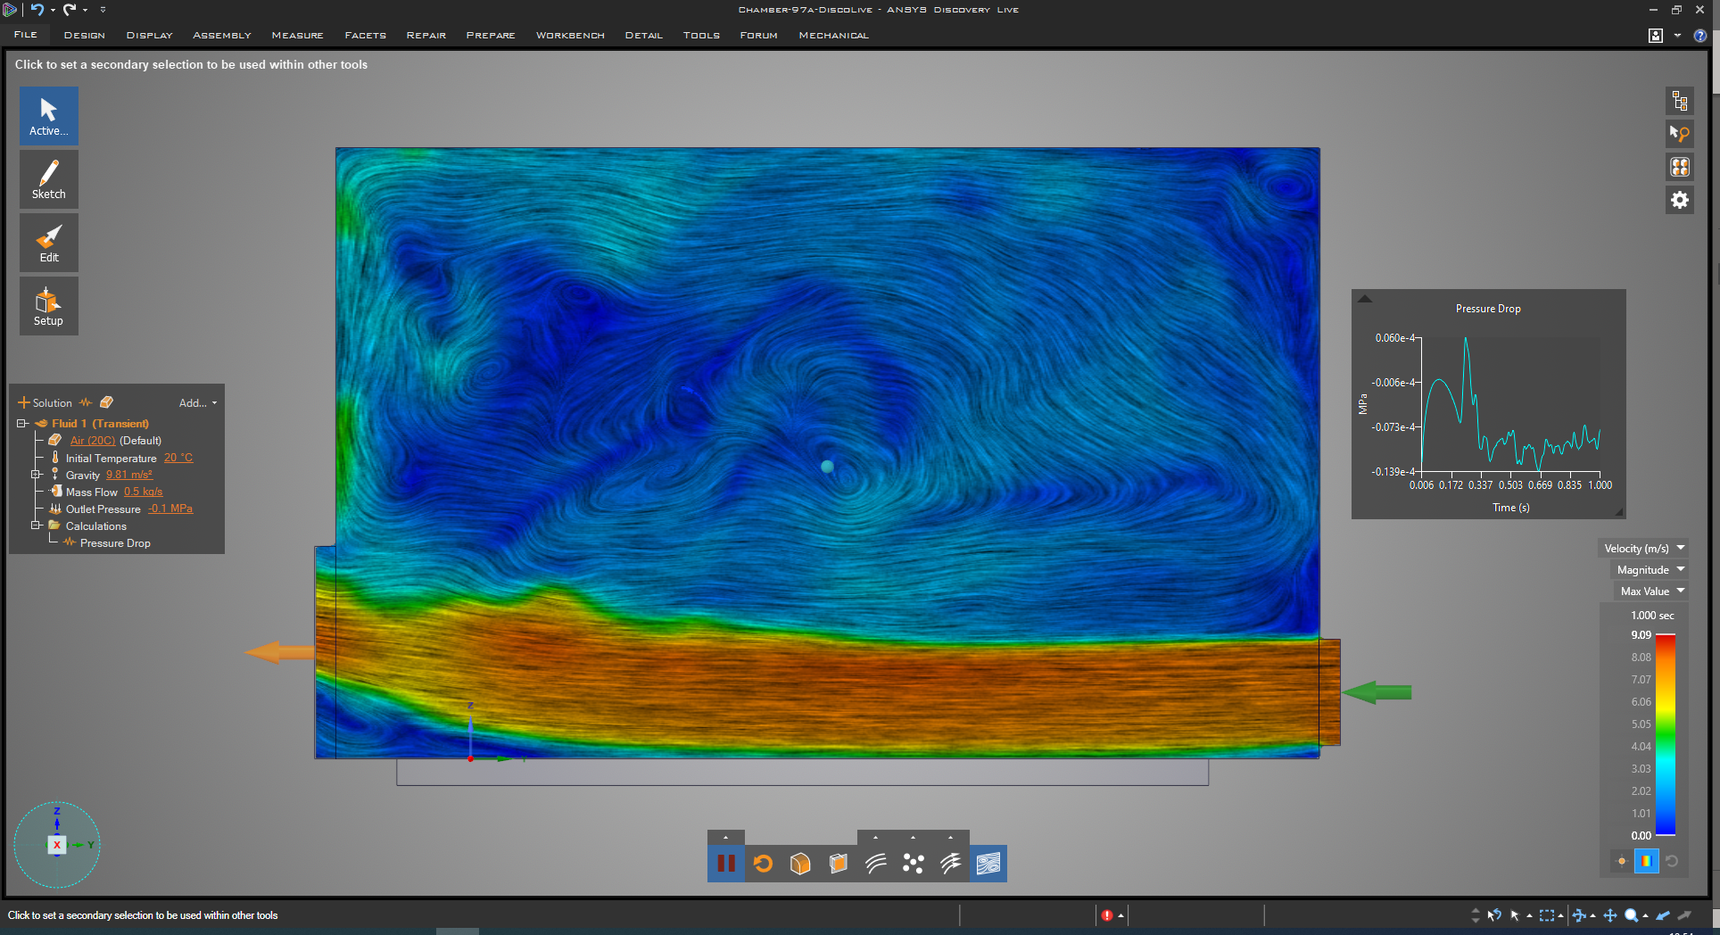
2020
2020 R1 PD = -7.8281e-06
🛈 This post originally contained file attachments which have been removed in compliance with the updated Ansys Learning Forum Terms & Conditions -
August 21, 2020 at 11:41 am
Charudatta Bandgar
SubscriberHello Tim Dukes ,
Thanks for doing this extensive comparative study, we really appreciate the effort.
I will investigate this further and will also share your observations to the concerned people.
Just to confirm, had you kept the fidelity and the systems used in all the runs (on different versions) the same?
Regards.
-
August 21, 2020 at 12:16 pm
tim.dukes
SubscriberHi yes all max fidelity using Nvidia GTX 1080.
-
August 24, 2020 at 4:44 am
Charudatta Bandgar
SubscriberHello Tim Dukes ,
Please go through the discussion threads shared by Bálint Papp and the intensive performance study they have done. If you still have any doubts, please feel to reach out I will try to find information from the developers and subject experts.
Regards.
-
-
August 23, 2020 at 7:59 am
papp
SubscriberHi Tim Dukes and Charudatta Bandgar ,
Off the top of my head, I'd say that the differences between 2019R3 and 2020Rx can be caused by the different mesh size at the same Fidelity level. I've also encountered this problem before.
Discovery Live mesh size: 2020R1 vs. 2019R3
TLDR: Due to a bug in a feature called 'Smart Memory Usage' introduced in 2020R1, the releases since can only utilize around half of the GPU's VRAM; hence, they create larger cells in a domain of the same volume.
You can check the mesh resolution by clicking the Options menu (gear icon on the top right) and enabling 'Show Minimum Feature Size'. It is also displayed if you hover your cursor over the Speed/Fidelity bar.
Kind regards,
Bálint
-
August 24, 2020 at 4:41 am
Charudatta Bandgar
SubscriberHello Bálint Papp ,
Thanks a lot for taking the efforts to study the Discovery product performance and providing this valuable information.
-
-
August 24, 2020 at 2:08 pm
tim.dukes
SubscriberHi Guys thanks for the input. Are we saying here that 2019R3 are the more accurate results due to being able to go to a smaller mesh size at max fidelity.
Customer is now questioning the validity of any of the results in 2020.
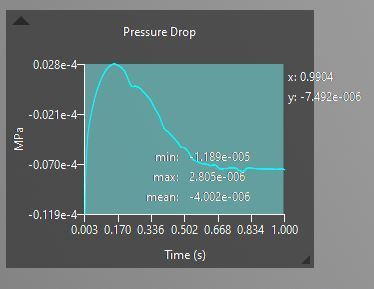
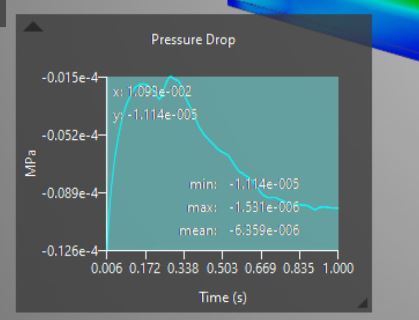
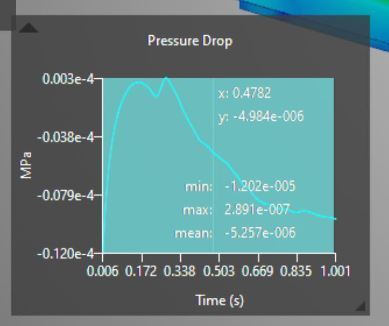
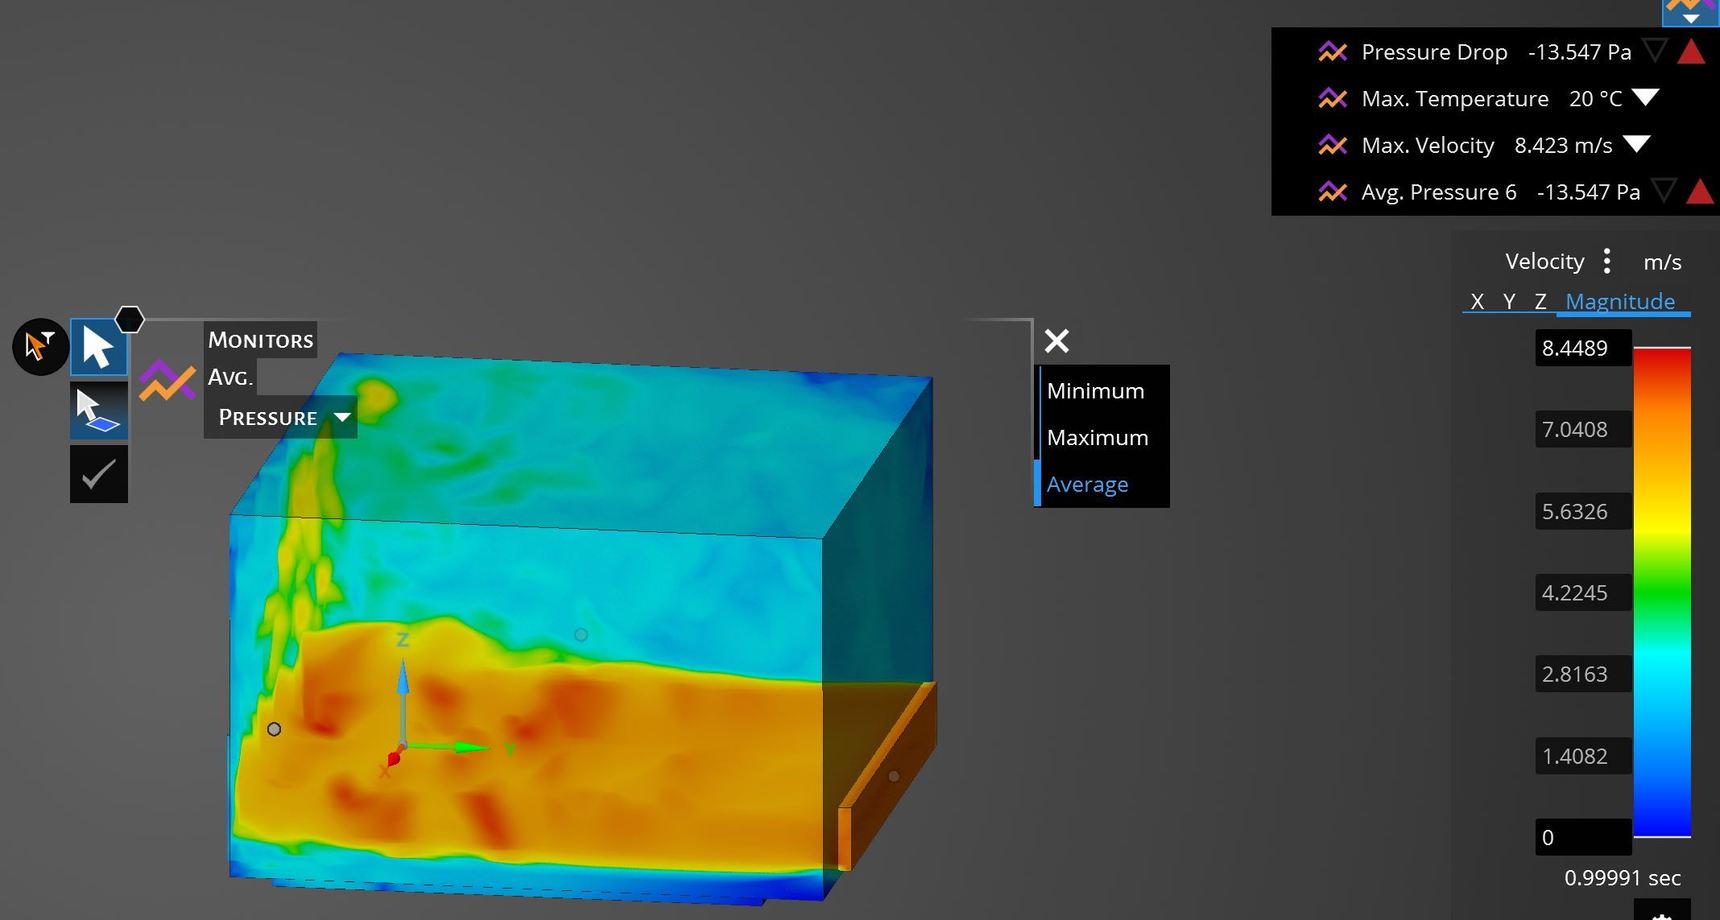
In the attached file we are trying to measure average pressure drop over 1 second. How would you recommend doing this in both Discovery Live and the new Discovery?
2019 R3 results Average pressure drop between all inlets and outlets over 1 second
2020 R1 results
2020R2 Results
Discovery
🛈 This post originally contained file attachments which have been removed in compliance with the updated Ansys Learning Forum Terms & Conditions
-
- The topic ‘Variations in results 2019 and 2020 LIVE (Fluids)’ is closed to new replies.


-
4663
-
1545
-
1386
-
1230
-
1021

© 2025 Copyright ANSYS, Inc. All rights reserved.

