-
-
May 20, 2020 at 1:12 pm
OguzhanA
SubscriberHello,
I have a thin-walled sample. I need to apply pressure and I'm new to ansys. There are results from the experiments and I have to compare them with the results in ansys. The deformation comes out too much and I don't understand what the problem is. At the same time, what do I need to do to achieve step-by-step stress and strain values? I would be glad if you could help.
I have test datas like a load. How can I analyze this problem and how can I do this step by step? I have to create like upper graphic.
I want to study the behavior of my material at any pressure.
But it is deformed linearly.
My material must be steel and flowing.
When I do non-linear analysis, I encounter a problem.
-
May 20, 2020 at 2:01 pm
Wenlong
Ansys EmployeeHi,
1. This video can probably give you some insights:
https://youtu.be/7ePBKlkGFqE
2. For the boundary conditions, you can apply a pressure load to the lateral surface of the cylinder, fixed support to the bottom surface, and a displacement control to the top surface. And in the result, you will obtain a force reaction at that displacement boundary condition, then you can use it to plot the load vs. displacement curve and compare it with the test data.Â
Regards,
Wenlong
Â
-
May 20, 2020 at 6:01 pm
OguzhanA
SubscriberThank you for answering my question.
I listened and applied the video to the end.
I obtained a graphic, but after the buckling load I calculated, I want the deformation to continue. When I increase the load it gives the same error again. I applied 0,001  Mpa in the linear buckling model and multiplier in mode-1 was 22,604. Now I'm doing an analysis again when large defletion is active. When it goes above 0.02 MPa, the solution is not realized.
Â
-
May 20, 2020 at 7:47 pm
Wenlong
Ansys EmployeeFor local buckling analysis, you probably need to turn on nonlinear stabilization in the analysis settings. You can try an energy-based stabilization with a dissipation ratio of 0.01. If that doesn't help, you can gradually increase that number. But make sure you check the stabilization output and compare it with the strain energy. It should be much smaller than the strain energy.
Regards,
Wenlong
Â
-
May 21, 2020 at 9:46 pm
OguzhanA
SubscriberWenlong firstly Thank you. Because I learned a new section in Ansys. I tried non-linear stabilization in the analysis settings. Then I obtain this curve.
My pressure value is 0,02 Mpa . I said that fistly I analyze eigenvalue buckling for 0,001 Mpa .Then I used multiplier (value=19,82) .Now I m looking my experimental data .Avarage value about 0,20-0,25 Mpa .
My analysis value is too small both displacement and pressure value.
Can I solve pressure value for displacement? for example : 30 mm displacement = how much pressure I need?
Regards,
Oguzhan
-
May 22, 2020 at 1:48 pm
Wenlong
Ansys EmployeeHi Oguzhan,
I may have misunderstood your problem. Can you please help me clarify?
1. In the test, is there a load compressing the cylinder on the top surface? Or pressure is the only load and the top and bottom faces are fixed?Â
2. What is the displacement obtained from the test? Is it the distance top face moved down or is it something else?
Knowing these can help me better assist you. Thanks!
Regards,
Wenlong
Â
-
May 22, 2020 at 2:14 pm
OguzhanA
SubscriberHi Wenlong,
The test setup is as illustrated above. There are plates at the top and bottom and they are fixed (no pressure or load effect). The thin-walled structure is between the two plates. We vacuum through a pump at the upper part. I perform vacuum analysis by applying pressure from the outer surface in Ansys.
1-only pressure and the top and bottom faces are fixed.
There are some experimental data and graphic on table.
Thank you for your interest Wenlong. If you don't mind, we can contact you via mail or Linkedin more easily. I can share some files with you. Ansys fails to upload files here.
Â
Â
-
May 22, 2020 at 7:16 pm
Wenlong
Ansys EmployeeHi Oguzhan,
Thanks for the explanation. Two more questions: In your load vs displacement plot, what is the displacement referring to? What does D-1, D-2... refer to?
Does your material include any of nonlinearity (like plasticity)? If so, you cannot use linear eigenvalue buckling, you will need to run it in static structural analysis for nonlinear buckling analysis. And in static structural analysis, you will be able to obtain a complete load vs displacement curve, while in linear eigenvalue analysis, you will only get a multiplier value. Please let me know if it makes sense and feel free to follow up.
Here are some relevant posts:
/forum/forums/topic/calculation-of-nonlinear-buckling-pressure-or-load/
/forum/forums/topic/nonlinear-buckling-load-is-greater-than-linear-buckling-load-why/
Regards,
Wenlong
================ Note ====================
If you have trouble opening the links I attached, please see the first useful link below
Â
Â
Useful Links
- How to access Ansys Online Help Document
- How to show full resolution image
- How to use Google to search within Ansys Student Community
Â
Â
-
May 22, 2020 at 10:01 pm
OguzhanA
Subscriber -
May 23, 2020 at 8:06 pm
Wenlong
Ansys EmployeeThanks for the explanation. I would recommend you conduct a nonlinear buckling analysis, which is directly run it in static structural analysis.Â
You may even introduce some initial geometrical imperfection (like shown below). The idea of initial geometrical imperfection is to multiply the eigenvalue buckling shape by a scale factor and add it to the uninformed geometry, then use the result as your initial geometry (as if your geometry is warped at the beginning). You will need to make the decision of which mode and what the multiplication factor is.
In the Static Structural analysis, you can add the element at D1, D2, D3, D4 locations to a name selection, then you can plot its displacement in post-processing.Â
Please let me know if that makes sense.Â
Regards,
Wenlong
Â
-
May 24, 2020 at 12:20 pm
OguzhanA
SubscriberThank you Wenlong,now I write step by step but I have some questions.
Firstly ,I create this algorithm .I used default structural steel (didnot entire yield strength or anyelse) Do I have to define?
Secondly, I applied pressure on surface (0.001 Mpa) Then find eigenvaluebuckling modes. Multiplier about 20. (In this stepi do I have open large deflectioni,stabilization settings?)
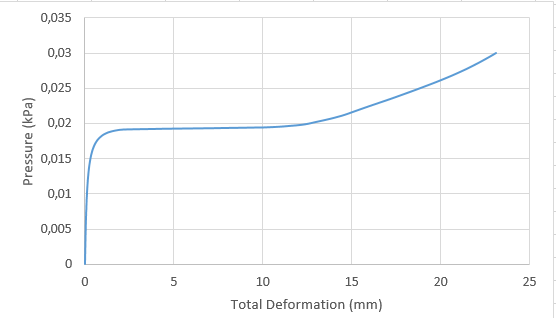
In last step, I applied real pressure (0,2 Mpa). But again I encountered a problem If I open large deflection settings and stabilization settings,Analysis suddenly stopped. But If I closed this settings , analysis was complated. But displacement-pressure graph was linear .
I think ?f you answer this questions ,we'll solve this problem.
Regards
OguzhanÂ
-
May 24, 2020 at 2:20 pm
Wenlong
Ansys EmployeeHi Oguzhan,
1. Yes, you need to define yield strength and tangent modulus for the steel, otherwise, the default steel is just linear material. The simplest material model you can use is "bilinear isotropic hardening".
2. Correct. In eigenvalue analysis, everything is linear, so you don't need large deformation and stabilization.Â
3. In the last step (static structural analysis), you do need large deflection and nonlinear stabilization. The reason it stopped (or more accurately speaking, unconverged) could be due to the large substeps. In the analysis settings, change the substep to automatic and define a minimum substep of 100, a maximum substep of 2000, and an initial substep of 200. Hopefully it will resolve the issue, if now we can follow up.
Regards,
Wenlong
Â
-
May 25, 2020 at 10:00 am
-
May 25, 2020 at 2:36 pm
Wenlong
Ansys EmployeeHi Oguzhan,
Is this wave number the same as your first mode eigenvalue buckling mode?
If not, please try to use the first mode shape as the "geometric imperfection" when you import deformed shape to Static Structural.Â
If yes, Maybe the initial geometric imperfection is too much and dominating the nonlinear deformed shape. You can try to reduce that multiplication factor or even not include "geometric imperfection" and see how it works.
Regards,
Wenlong
Â
-
May 26, 2020 at 12:03 pm
OguzhanA
SubscriberI tried Mesh element size. If I increase element size ,Wave number is reduce. Like a Photo. (My experimental element s wave number 5 or 6.) You think is that true? Becuase Mesh size is important for true value and behavior.
wave=black frame (first model can deform 0-0,3 MPa,but second model can deform 0-0,14 MPa,if I increase more 0,14 Mpa analysis was stopped.)
Two analysis model have same analysis settings. (Both model analyze 1 kPa and eigenvaluebuckling then static structural analysis. As we talked above.)
But only different mesh element size. First model mesh size=20 mm and Second model mesh size=200 mmÂ
Regards,
Oguzhan
-
May 26, 2020 at 12:59 pm
Wenlong
Ansys EmployeeHi Oguzhan,
The second model definitely have a mesh that is too coarse, and you cannot rely on the result with such a large mesh. The smaller the mesh is, the more accurate the result is.Â
Is your cylinder made of shell elements or solid elements?Â
Regards,
Wenlong
Â
-
May 26, 2020 at 1:10 pm
OguzhanA
Subscribercylinder made shell (height=1250 mm and thickness=1 mm R=500 mm) I made this only surface modelling then in Ansys I choose thickness. How can I find in ansys shell or solid?
-
May 26, 2020 at 1:42 pm
Wenlong
Ansys EmployeeIf it is a surface in the model and you chose thickness, then it is shell element.Â
One thing you wanna check is your boundary condition. Did you apply fixed support to the top and bottom? You will need to apply a fixed rotation as well if their rotational degree of freedoms are fixed in the experiment as well.Â
Regards,
Wenlong
Â
-
May 26, 2020 at 3:06 pm
OguzhanA
SubscriberYes,I applied fixed support to bottom and top.
I dont understand,model becomed deformed about 4mm (0,14 mpa) But ?t can bear more than. For example I want to deformed 50 mm in cylinder. How can I obtain this?Â
Regards,
Oguzhan
-
May 26, 2020 at 3:33 pm
Wenlong
Ansys EmployeeThe reason it is able to deform that much is Structural Instability. It refers to a phenomenon where there is a large change in deformation but little change in force (or stress). One example you can think of is buckling, which is also your case.Â
To achieve that you will probably need a relatively large nonlinear energy stabilization factor (say 0.05).Â
This simulation example can probably give you more insights:Â https://ansyshelp.ansys.com/account/secured?returnurl=/Views/Secured/corp/v194/ans_tec/tecbucklingresults.html
!
!
!
Alternatively, you may also consider the Arc-length method (Ref:Â https://scholar.harvard.edu/files/vasios/files/ArcLength.pdf) because it is able to capture the negative force-displacement slope. To do that, you can add a command snippet to the analysis, then type in the following commands:
ARCLEN,ON,, ! Activates the arc-length method
DELTIM,0.01,0.0001,0.1 ! Specifies the time step sizes to be used for the current load step
To find the meaning of these commands you can refer to the Ansys help documentation (https://ansyshelp.ansys.com/account/secured?returnurl=/Views/Secured/corp/v194/ans_cmd/Hlp_C_ARCLEN.html?q=ARCLEN and https://ansyshelp.ansys.com/account/secured?returnurl=/Views/Secured/corp/v194/ans_cmd/Hlp_C_DELTIM.html?q=DELTIM)
Something to keep in mind: if you are to use the Arc-length method, the pressure you applied needs to be a constant value instead of tabular data. Also, automatic time stepping will be neglected. I would recommend you try the nonlinear stabilization method first before you try the Arc-length method.Â
Regards,
Wenlong
================ Note ====================
If you have trouble opening the links I attached, please see the first useful link below
Â
Â
Useful Links
- How to access Ansys Online Help Document
- How to show full resolution image
- How to use Google to search within Ansys Student Community
Â
-
May 27, 2020 at 2:12 pm
OguzhanA
SubscriberStabilization settings could solve my problems,thank you for your aids,Wenlongs !
-
September 7, 2020 at 4:34 am
OguzhanA
SubscriberHi @Wenlong, can you help this?
I have a buckling analysis about cylinder. I analyzed it using stabilization setting. But my result isn't what I want. Theoretically , Cylinder behavior curve should be negative slope(figure-1). But in My result ,curve is positive slope(figure-2) . Critical Buckling Load can be true,but ı think behavior is failed.
https://us.v-cdn.net/6032193/uploads/3ZGKDFBTZ6IH/1-png.png
https://us.v-cdn.net/6032193/uploads/NGB12867EL9K/2-png.png
figure-1
https://us.v-cdn.net/6032193/uploads/1E3M0NJKQ1W2/2-png.png
figure-2
I will be glad if you give an idea!
Regards
Regards
-
- The topic ‘Thin-walled’ is closed to new replies.
-
6144
-
1906
-
1442
-
1308
-
1022
© 2026 Copyright ANSYS, Inc. All rights reserved.


