-
-
December 21, 2025 at 5:55 am
1479601362
SubscriberI have two similar calculation cases with only geometric differences. When viewing their pressure cloud maps, I opened the "Post Line Contour Mode" Fig.2 and used the ALE method. Three line contours appeared in the graph, all of which are three-dimensional spatial curves, which is consistent with the actual situation. Fig.1 uses the S-ALE method, which only shows a two-dimensional line contour on two symmetrical planes. This is not consistent with the actual situation. How should I set it to display the correct line contour when using the S-ALE method?

-
January 9, 2026 at 5:34 pm
Ian Do
Ansys EmployeeHello,
Could you please define the physics of what you are modeling first?
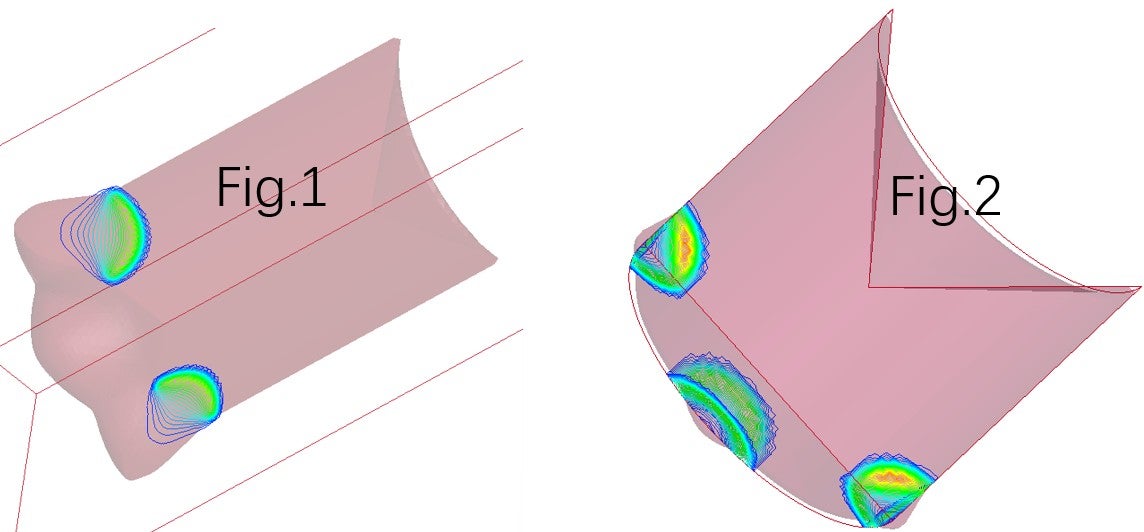
I cannot understand what I am looking at, what your ALE meshes look like, what the materials are (pink=?), are there Lagrangian parts involved (FSI? or fluid-structure interactions?) ...
If you show a (P, ...) plot, please indicate the time plotted.
Once that is defined clearly, I may be able to assist.
Regards,
Ian Do
-
- You must be logged in to reply to this topic.
-
5844
-
1906
-
1420
-
1305
-
1021
© 2026 Copyright ANSYS, Inc. All rights reserved.