-
-
May 31, 2020 at 8:53 pm
ham_nola
SubscriberHi,
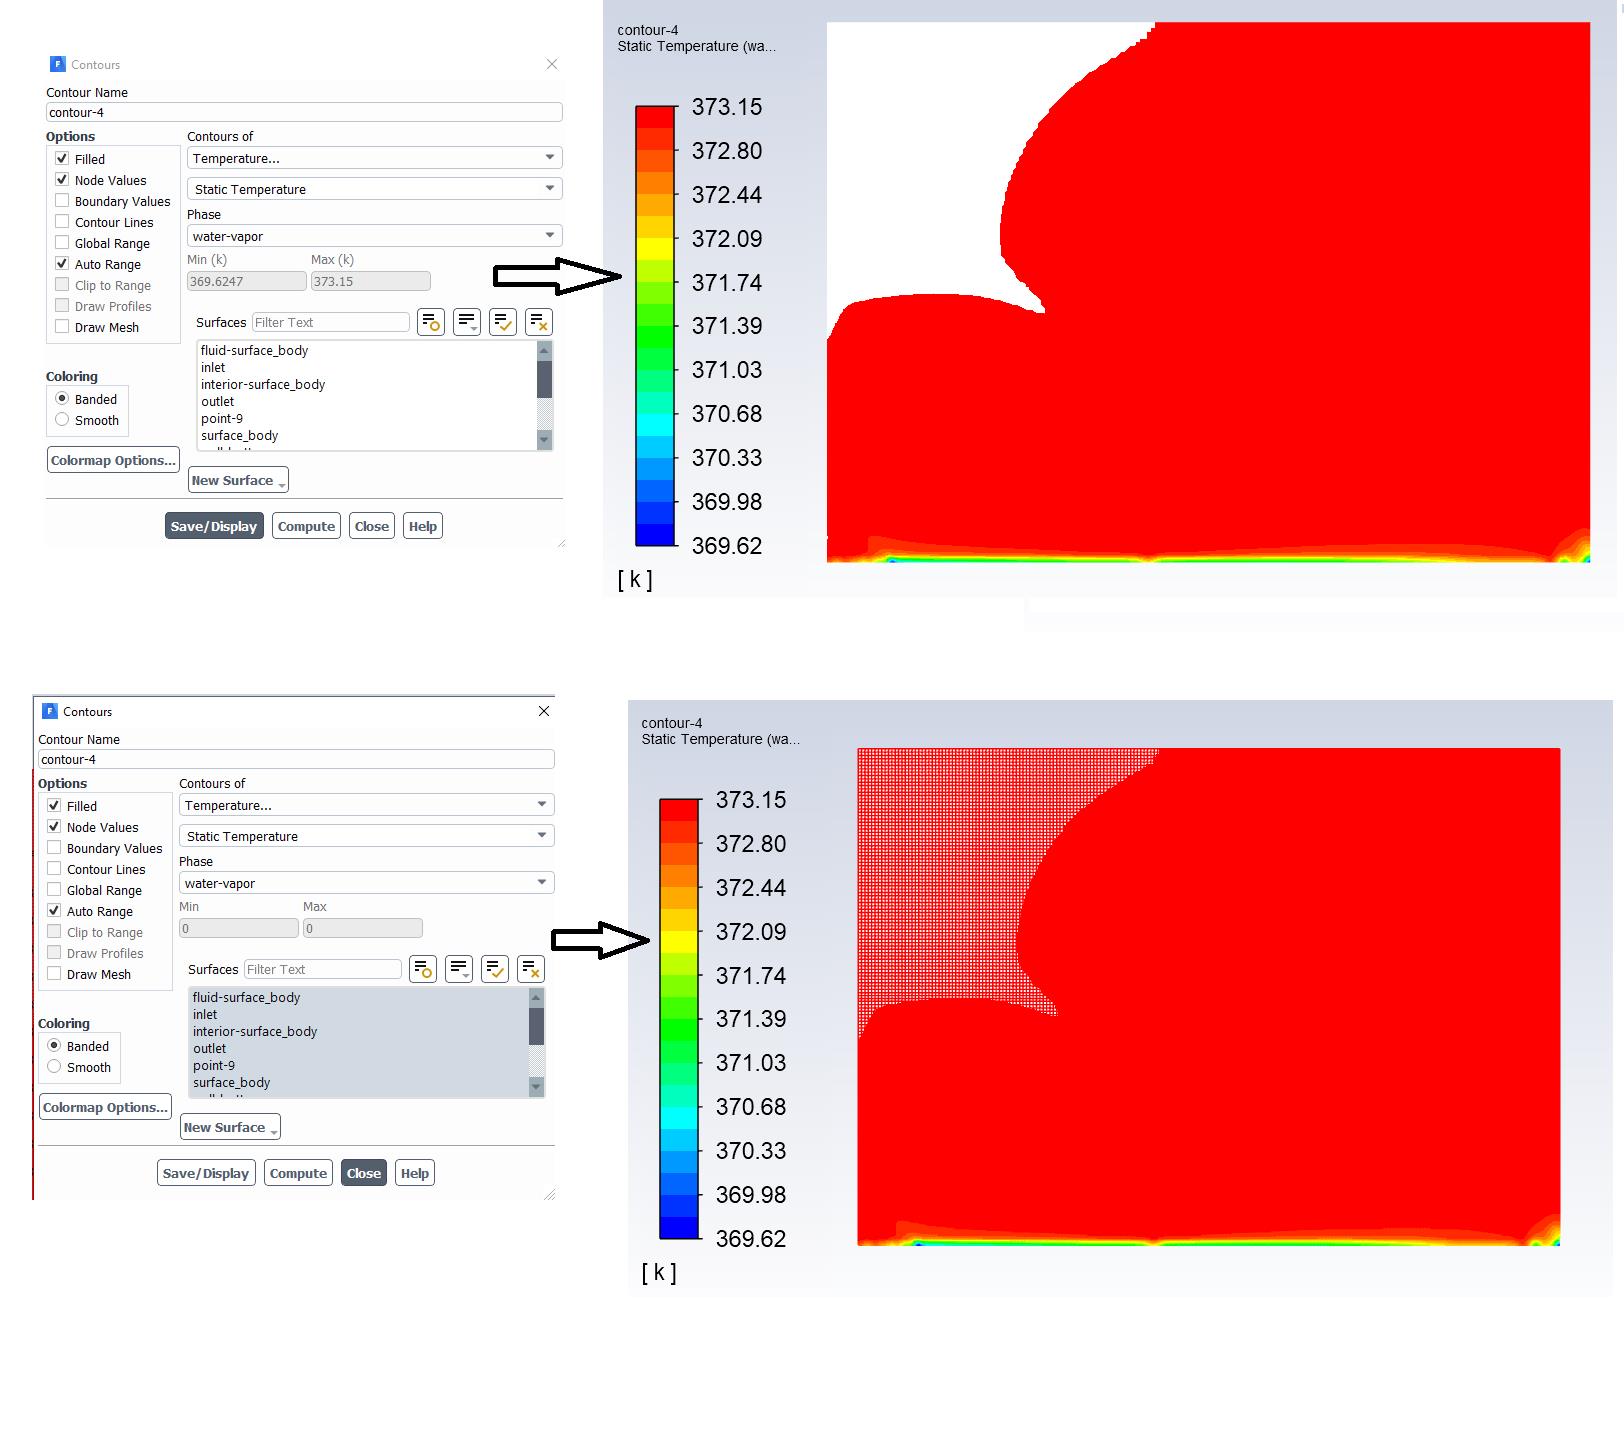
I have the following contour plot. Although the "filled" option is selected, yet the post-processing in Fluent shows some missing area. The solution I'm expecting is how to ensure it fills all the domains.
Even if I select the surfaces, it shows the contour plot on the mesh. It the second plot.
I appreciate the help. Thank you.
Best regards,
Hamed.
-
June 1, 2020 at 10:09 am
Karthik Remella
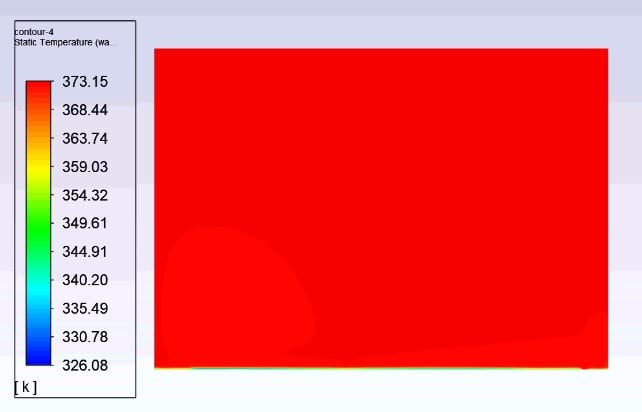
AdministratorIf this is a 2D simulation, could you please deselect all surfaces, make sure that the Global Range option is checked, and plot the contour? Could you also check 'Boundary Values' and try?
Thanks.
Karthik
-
June 2, 2020 at 5:59 am
-
June 2, 2020 at 12:18 pm
Rahul Kumar
Ansys EmployeeHello Hamed,
Is it just the temperature contour or is this occurring while plotting pressure contours too?
-
June 8, 2020 at 7:57 am
-
June 8, 2020 at 9:03 am
DrAmine
Ansys EmployeeWhich release version? Other fields affected?
-
June 8, 2020 at 11:43 am
ham_nola
Subscriber2020 R1
-
June 8, 2020 at 11:46 am
ham_nola
SubscriberI plot pressure, velocity, volume fraction. They are fine.
-
June 8, 2020 at 2:19 pm
Rahul Kumar
Ansys EmployeeHello,
When you are using "Banded", can you uncheck "Node Values" under the Options menu and plot the contour.
-
June 8, 2020 at 11:06 pm
-
- The topic ‘Temperature contour plot on a 2D domain’ is closed to new replies.


-
3737
-
1328
-
1163
-
1090
-
1014

© 2025 Copyright ANSYS, Inc. All rights reserved.


