TAGGED: lsdyna
-
-
May 8, 2024 at 3:50 pm
mmia1
SubscriberHi
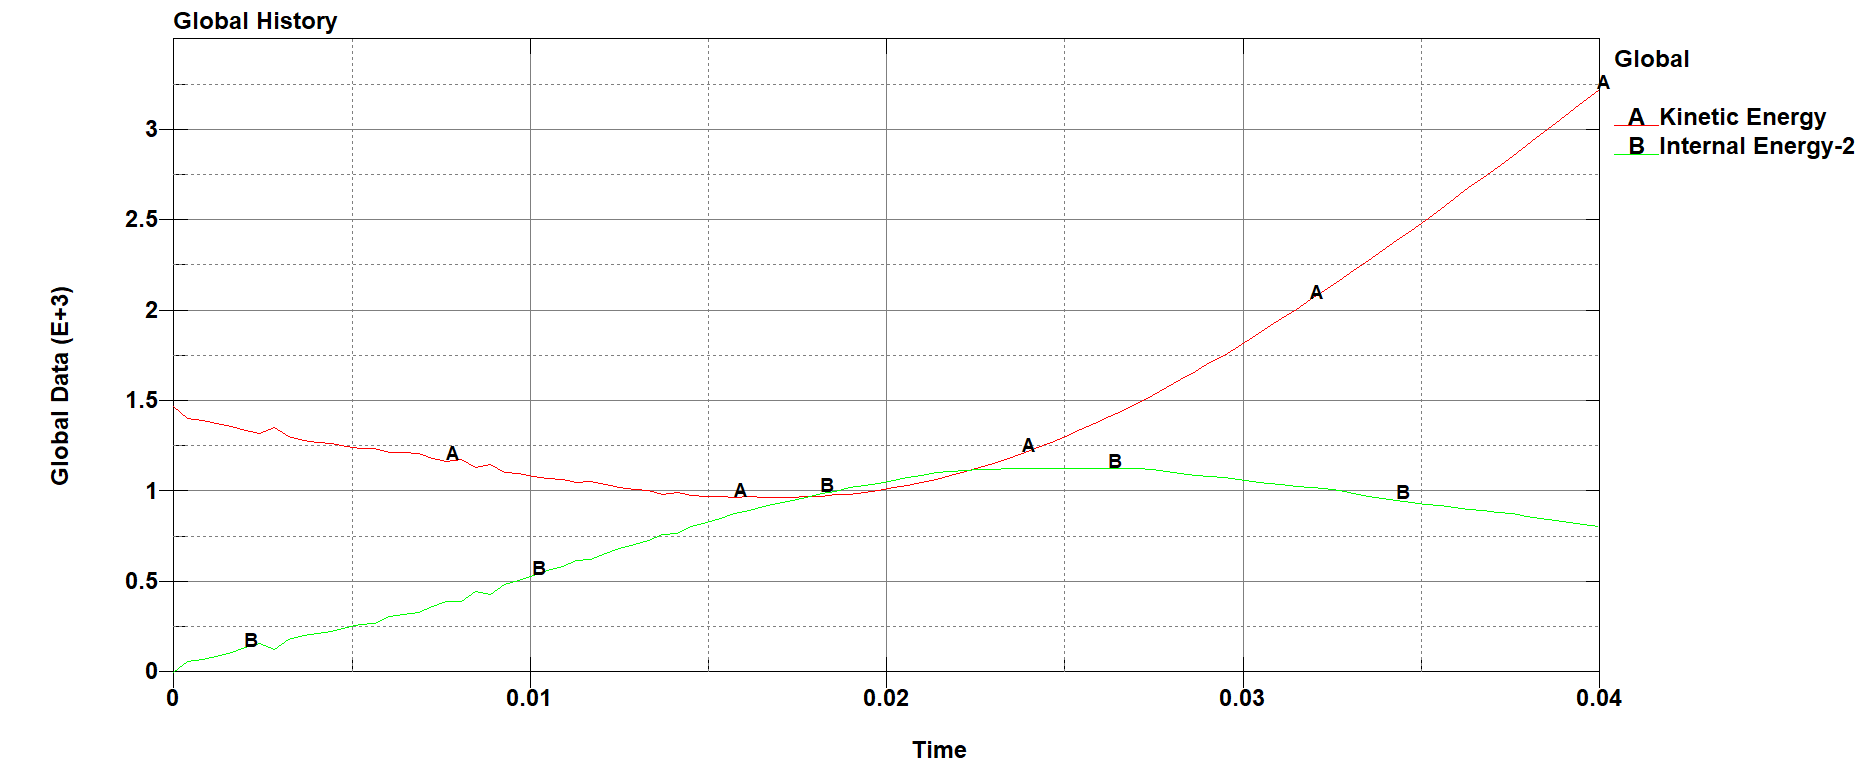
I performed an explicit analysis where an object (elastic wood) hits a tank steel shell with 3 m/s. After t = 0.04 sec, this is the energy plot I got. My question is whether this energy plot seems okay. One of my colleagues said that kinetic and internal energy plots tell us about explicit analysis whether it is successful or not. -
May 9, 2024 at 5:49 pm
Reno Genest
Ansys EmployeeHello,
From this graph, we can tell that you have some kinetic energy and zero internal energy at time=0. Your wooden object probably has some initial velocity and comes into contact with the steel tank right away because we see the internal energy go up and the kinetic energy go down right away after time=0. Usually, we would like to have a bit of a delay (have a gap between the wooden object and the tank) before internal energy starts increasing. The gap between the wooden object and the tank would ensure that you don't have initial penetration in your contact; initial penetration can cause contact issues that can be seen in the sliding energy.
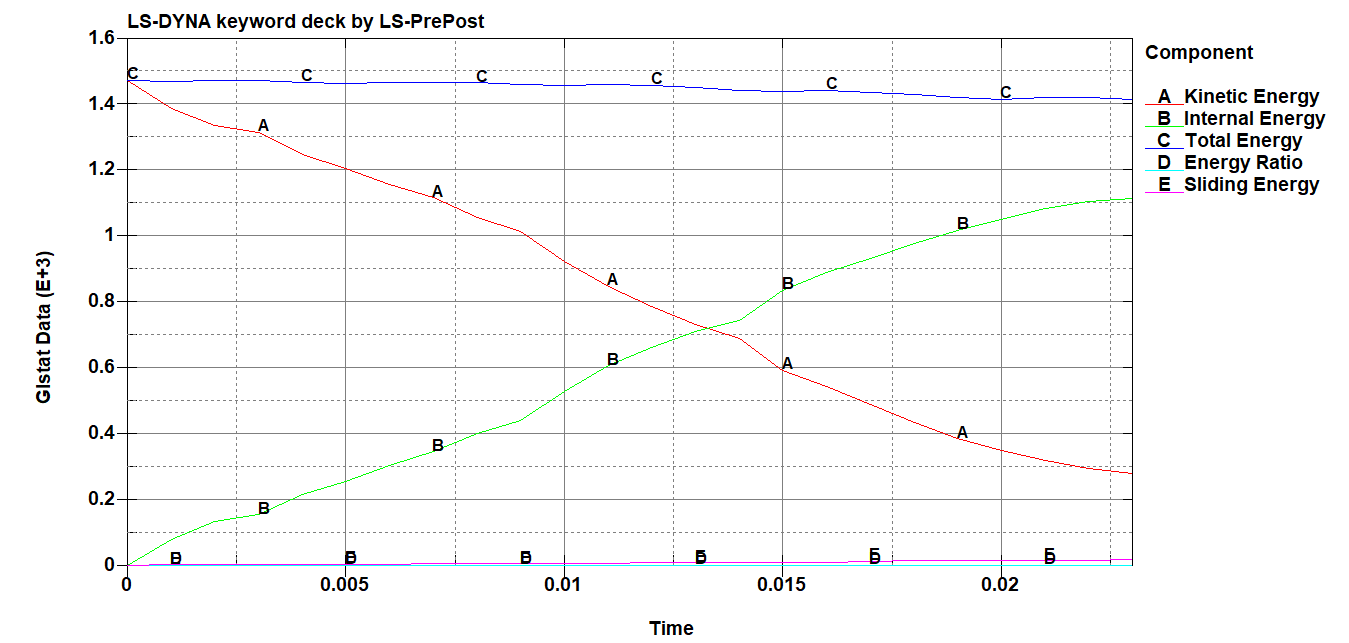
If you only have an initial velocity in your model (no prescribed velocity or displacement, no forces, no pressure, etc.), the total energy in your simulation should be constant. You could plot the total energy to see what it looks like. But, from the kinetic and internal energies, we see that the sum of the 2 energies is larger at the end of the simulation compared with time=0. This is not correct if you only have an initial velocity and no external work done by prescribed motion or other loads. So, you might want to verify your model.
Also, note that in LS-DYNA, conservation of momemtum is enforced, but conservation of energy is not. So, the run will keep running even though energy is not conserved. It is the responsibility of the user to verify that energy is conserved by post-processing the GLSTAT database after a run.
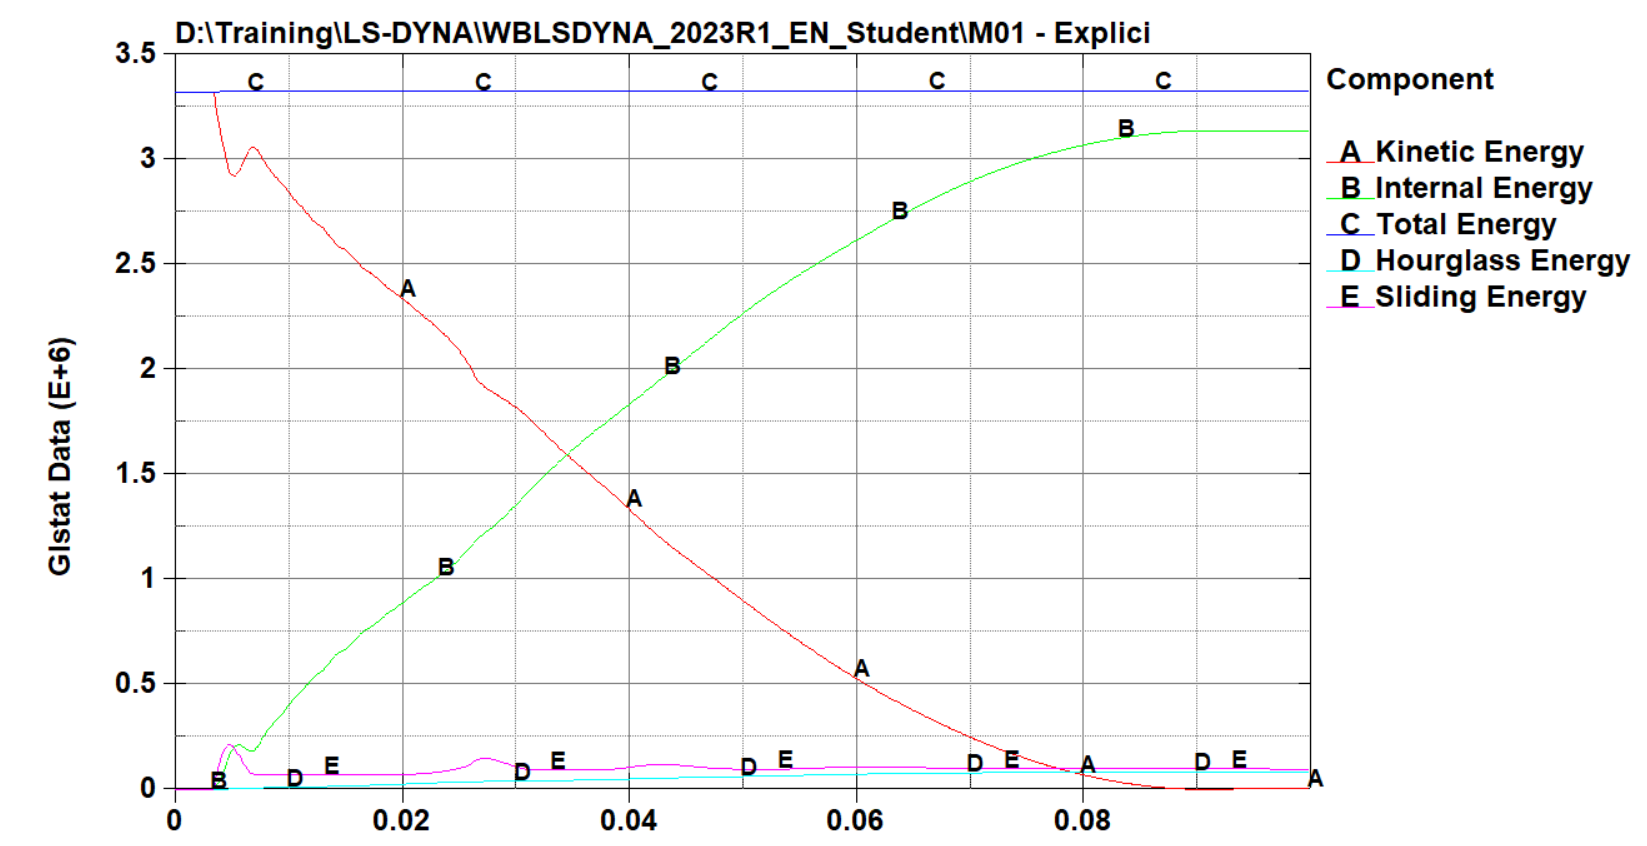
I would also plot the sliding energy (contact energy) and hourglass energy. If you don't have friction, sliding energy should be zero or very low. A rule of thumb is to have sliding energy and hourglass energy lower than 10% of internal energy.
A typical energy graph with only initial velocity would look like this:
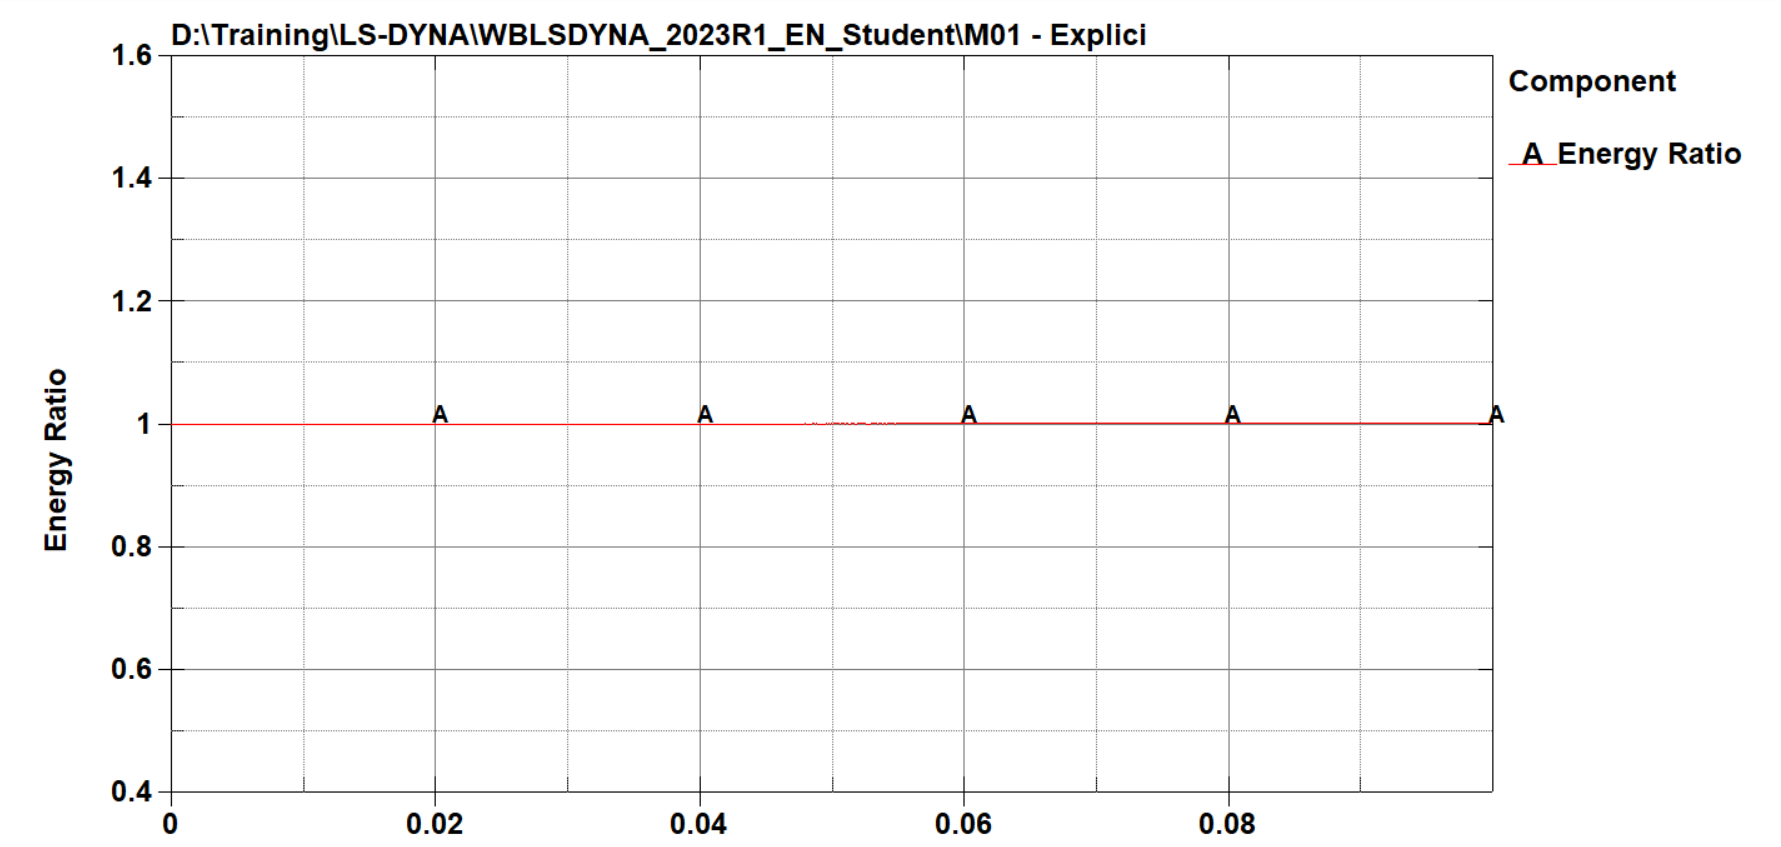
And the energy ratio should be equal to 1:
You will find more information on energies in LS-DYNA here:
https://lsdyna.ansys.com/total-energy/
https://www.dynasupport.com/tutorial/ls-dyna-users-guide/energy-data
Let me know how it goes.
Reno.
-
May 9, 2024 at 6:41 pm
mmia1
SubscriberHi
Thanks for your informative reply. Here are some details of my model. I have defined gravity load on my tank part (not the pipe or impacter part) by Load_gravity_Part. Second thing is that I also applied damping (2%) in the tank not in the pipe like below:I also defined Automatic_surace_to_surface where pipe is slave and tank course 1 where pipe is hitting is considered as master with static and dynamic friction coefficients are 0.21 and 0.19.
There are some gaps kept (small distance) looks like below:
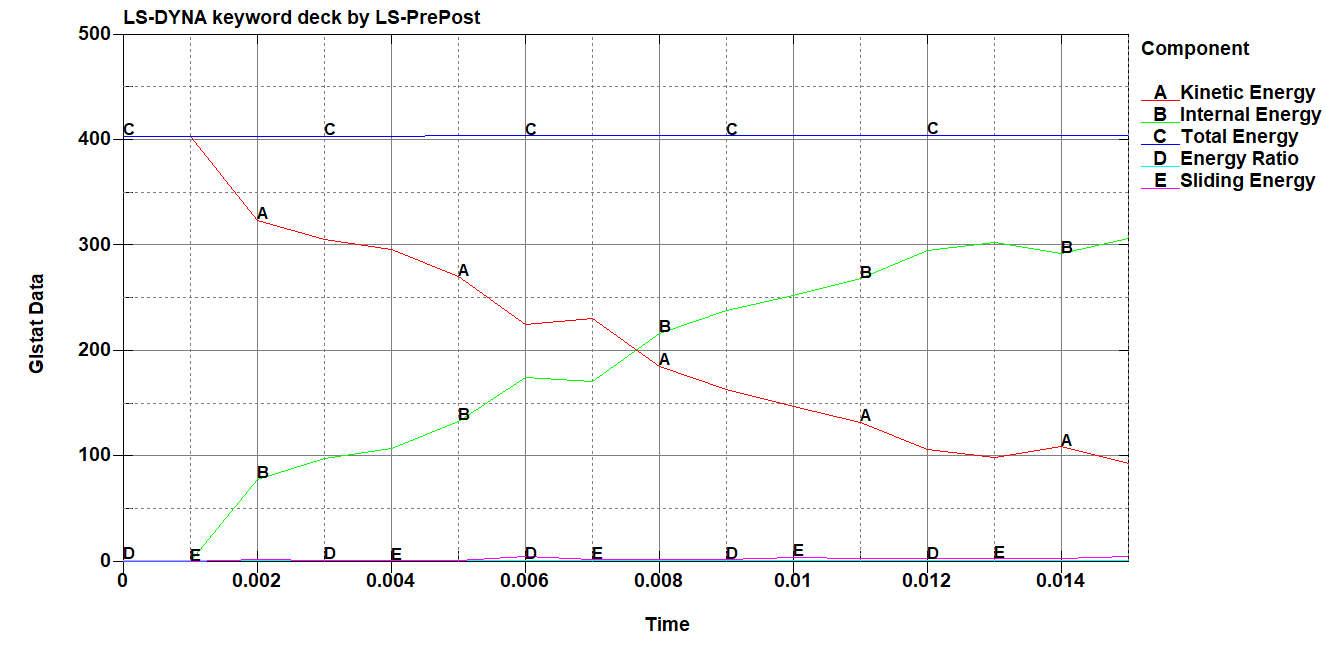
The pipe and tank course 1 where pipe is hitting defined as MAT_003 (plastic kinematic) with strain rate parameters defined. So, this is plot I got after loading glstat:
In my model, I have initial velocity applied to the pipe as 3 m/s. Yes, there are no prescribed motion except Load_gravity_part applied to tank part.
Another think to mention the termination time is 0.03 sec. Since it is taking too much time. But with that time the pipe hit the tank and rebounded. That I checked. You can also see from the below figure of a node of pipe front.Do you know what is messing up my results as my energy plots are quite different than yours. Thanks.
-
May 9, 2024 at 8:21 pm
Reno Genest
Ansys EmployeeHello,
Try to plot hourglass energy on top of all the other energies. Is hourglass energy high compared with internal energy? Does hourglass energy account for the energy “generated” in the model and contribute to the increase in total energy?
Also, does it make sense that gravity adds this much energy to the total energy? Do you have a way to calculate it by hand? Could you run the model without gravity and see the effect on total energy? Are there other loads or prescribed motion in the model that you are forgetting or neglecting that could do external work?
Note that Ansys employees are not allowed to upload and download files on the Ansys Forum. If you are a commercial customer and you want us to look at your model in more details, please create a support case on the Ansys Customer Support Space (ACSS):
customer.ansys.com
Let me know how it goes.
Reno.
-
May 10, 2024 at 5:02 pm
mmia1
SubscriberHi
I ran my same model without Load_gravity_part_set. And now the energy plot seems reasonable as mentoned by you.
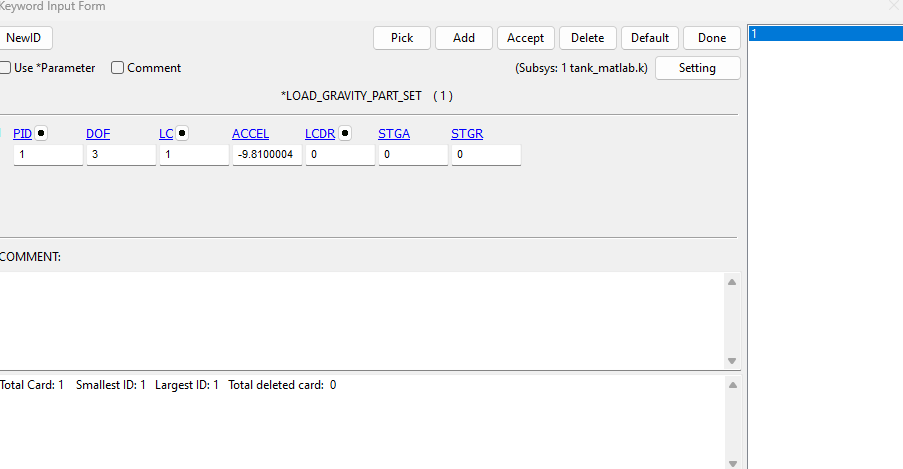
SO, using Load_gravity_part_set applied to seven course parts of tank cuses the issues. I defined it loke below:
Do you think I should define it as Load_body_z instead of Load_gravity_part_set? I mean why the Load_gravity_part_set definition makes the model behaving so weird since the energy plots not good. Thanks.
-
-
May 12, 2024 at 4:18 am
-
- The topic ‘Successful explicit analysis’ is closed to new replies.


-
3437
-
1057
-
1051
-
902
-
896

© 2025 Copyright ANSYS, Inc. All rights reserved.

