-
-
December 13, 2018 at 8:14 am
thanhttdt
SubscriberHi everybody,Â
I would like to ask your help that I have a plate with stiffeners which are suffered compression load (bottom edge is fixed, top edge is free).Â
It can be seen that, with the wide plate, reaction force and stress at each node at the bottom will be different
So now I want to plot stress-strain diagram to know the value of ultimate stress. So, can anyone guide me how to show total reaction force at the bottom edge then plot the stress-strain diagram?
Material: Young’s modulus, E = 200 GPa; Poisson’s ratio m = 0.3, Reh = 690 Mpa
Plate: width x length x thickness = 300x1200x4 mm
2 Stiffener: FB 20x4 mm, 2 girder: L50x20x6
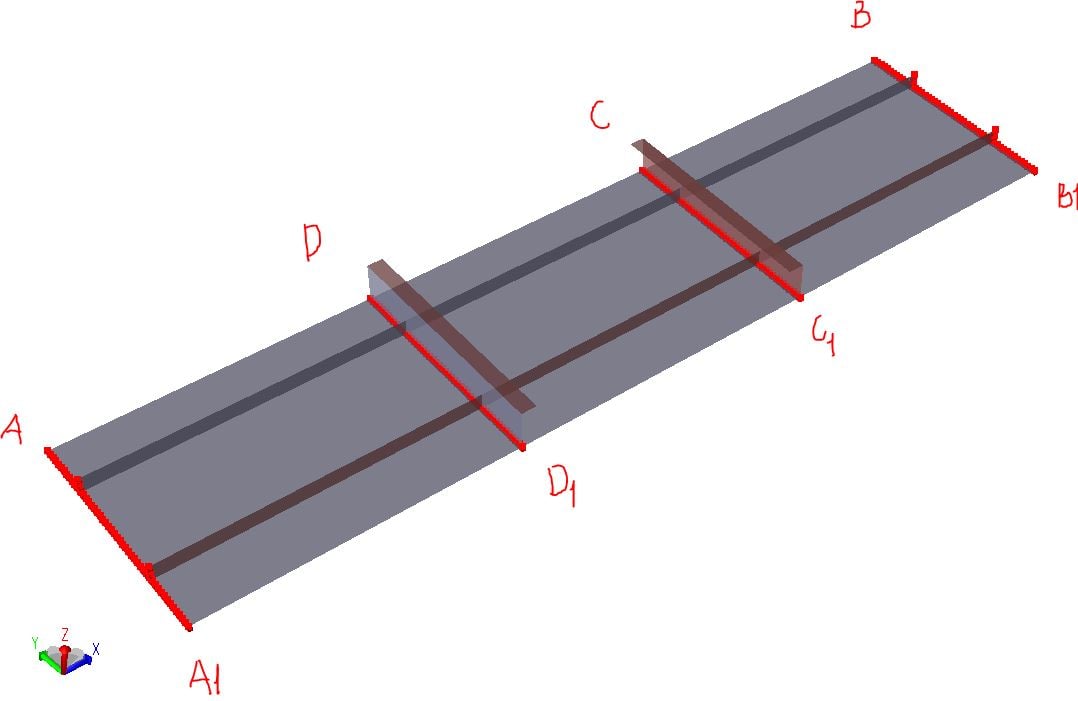
At the bottom edge of the plate and stiffeners (A-A1): all DOFs are fixed
At the top edge of the plate and stiffeners (B-B1): there is only UXÂ is free and equal
At the C-C1 and D-D1: fixed uz
I also attached the apdl project here, so please give me your support.Â
https://drive.google.com/file/d/1qIziTRnLpmO9ld0l4Bk5rvrDsx7UuYPt/view?usp=sharing
Thanks in advance
-
December 13, 2018 at 10:56 pm
Sandeep Medikonda
Ansys EmployeeIf you want to understand how to calculate the reaction force or the stress-strain plots in elements. I would recommend you to some of the Cornell Learning modules or the examples listed in the verification module. Also, please see the following resources:
https://www.youtube.com/watch?v=VdWIHfO9-Mc
Regards,
Sandeep -
December 14, 2018 at 2:33 am
thanhttdt
SubscriberHi Sandeep,
Thanks for your quick reply and support,Â
My concern is how to get ultimate stress and then plot stress-strain diagram, it means now we don't know the load, and we want to get the maximum load that structure can be withstood and then make the plot stress-strain diagram.
Could you please give me any ideas for that?
Many thanks,
Thanh,
-
December 14, 2018 at 3:05 am
Sandeep Medikonda
Ansys EmployeeThanh,
 I don't quite get what you mean? People often use von-mises stress as a gauging factor. You see a model in a simulation will often undergo/experience a multiaxial stress state, so WB-Mechanical uses the Mises yield criterion to relate a multiaxial stress state with scalar test data (uni-axial data). So basically it gives you one number to judge the stress in a model. You can also check the Max. Principal Stress from the Worksheet. which will give you the maximum stress your model is experiencing based on invariant directions (Remember the Mohr's Circle).
 Now, if you want to define failure of your model based on a certain stress (ultimate like you say) or strain, you can do that using command snippets. Peter talks about how to do this in this excellent post. If you want to look at the multi-axial stress state in every direction, principal stresses and equivalent stresses etc for each element, you can click on Solution in the structure tree, then on Worksheet and select the component you wish to see. You can also build stress-strain charts as you want from this here as well. Just insert a chart, scope it to the stress and strain objects in the structure tree and Omit the time after assigning Strain to the X-direction and Stress to the Y-direction.
 Hope this helps.
Regards,
Sandeep
-
- The topic ‘Stress and strain diagram’ is closed to new replies.
-
5874
-
1906
-
1420
-
1306
-
1021
© 2026 Copyright ANSYS, Inc. All rights reserved.
