TAGGED: stagnation
-
-
November 1, 2023 at 9:38 am
Meri Gjika
SubscriberHi, I have done a simulation in Ansys fluent and want to visualize in the results the stagnation of velocity applying a limit (like the stagnation of velocity<0.005m/s). Also, I want to show the shear rate but even here I do not know how to do so because from the data after the simulation I have only the wall shear stress.
Do you have any recommendations on how I can visualize them?
-
November 1, 2023 at 12:38 pm
Federico
Ansys EmployeeHello,
when creating countours, you have options in the Contour dialog box to Auto-Range and Clip-to-Range. Turn off Auto Range to set your own range. Turn off Clip-to-Range if you want to hide any values outside of your range.
For shear rate, you can use Strain rate: 41.4. Alphabetical Listing of Field Variables and Their Definitions (ansys.com)
-
November 1, 2023 at 2:09 pm
Meri Gjika
SubscriberHi, thank you for your response.
I solved the countours range. And I understood that I can use strain rate in place of shear rate but I do not understand how to visualize it, because I do not know where to find it in my data, do you have any suggestion?
-
November 1, 2023 at 3:02 pm
-
November 2, 2023 at 9:26 am
Meri Gjika
SubscriberHi,
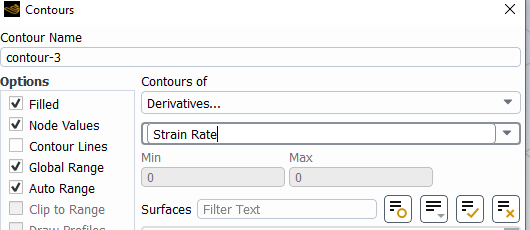
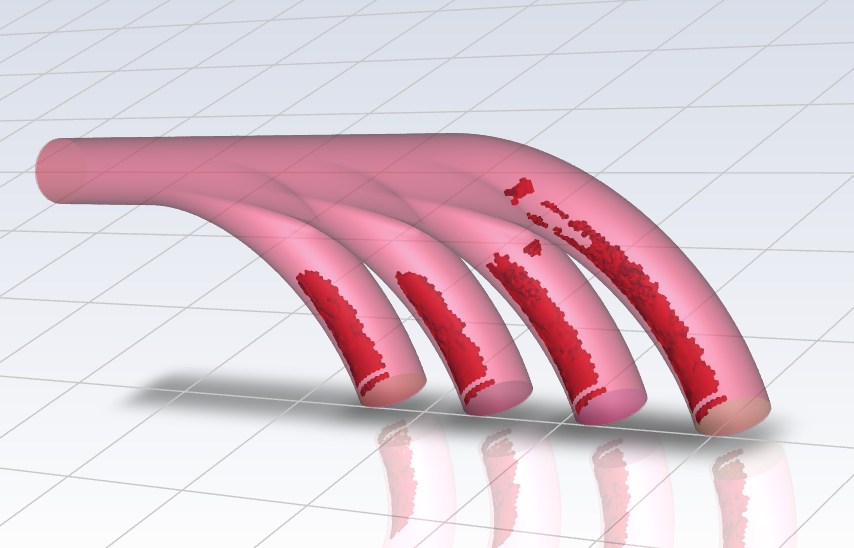
I tried to visualize it in contours derivates as you showed me in this screenshot but, in reality, I am using CFD POST for the post-processing so how I visualize the stain rate from Fluent is not exactly what I want to see. I want something like this:

So the red areas are where the strain rate is lower than 0.1 s^-1. I want to obtain something like this.
-
November 2, 2023 at 12:29 pm
-
- The topic ‘Stagnation of velocity, and shear rate’ is closed to new replies.


-
4678
-
1565
-
1386
-
1242
-
1021

© 2025 Copyright ANSYS, Inc. All rights reserved.


