Ansys Assistant will be unavailable on the Learning Forum starting January 30. An upgraded version is coming soon. We apologize for any inconvenience and appreciate your patience. Stay tuned for updates.
Fluids

Fluids

Topics related to Fluent, CFX, Turbogrid and more.

Spray Combustion with FGM, occurs wrong temperature distribution.

    • fanbo9802
      Subscriber

      Dear all,

      I am conducting spray combustion, which actived the DPM and FGM model. Two cases have been simulated, both of them occured questions on temperature distribution.

      The first case is spray with low-velocity air and normal temperature conditions, which the values are 0.245m/s and 300K, though combustion could give a relative accuracy result, but close to the inject faceplate, there was no flame, which cannot compared with experimental data. Temperature distribution shows as Fig.1. The particle contour reveals the temperature maintain 300K, which is the inlet condition of DPM, when I attempted to patch progress as 1 and temperature as 2000K, the case will totally wrong.

      Changes of air velocity and temperature in the second case,  with the values are  2.5m/s and 1400K. This time the flame shows a good performance, while the temperature in centeral region is higher than experimental data. As Fig. 2 shows.

      The time step of them is 1e-5 s.


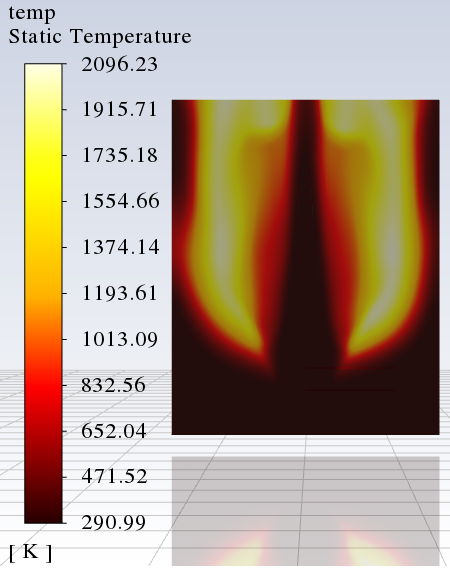
      Fig.1 Temperature distribution in case1.

      Fig. 2. Comparsion between simulate result and experimental(line represents simulation).

    • Ren
      Ansys Employee

      The velocities look very low and the flow is more likely laminar. If this is the case then the FGM model is not valid, strictly speaking. Anyway, what turbulence closure is used for the FGM model? Could you check the Reynolds number and the turbulent viscosity ratio? Some contour plots would be useful. 

      • fanbo9802
        Subscriber

        As you say, the flow velocity is low, the domain diameter is 0.12m, it seems not a turbulent field, the spray velocity is 15 m/s. I used the Realizable K-e model. Here shows the velocity contour and turbulent viscosity ratio, also with the Re. By the way, the experiments were conducted in a open boundary condition, I set the around boundary as wall rather outlet, may be I should switch it?

        As for Fig.2 in my case, I modified spray model and patch region, higher temperature in the beginning has been improved.


Viewing 1 reply thread
  • You must be logged in to reply to this topic.
[bingo_chatbox]