TAGGED: fdtd, FDTD-Refractive-Index-Grading, Lumerical-FDTD
-
-
November 1, 2024 at 4:29 am
hjiangba
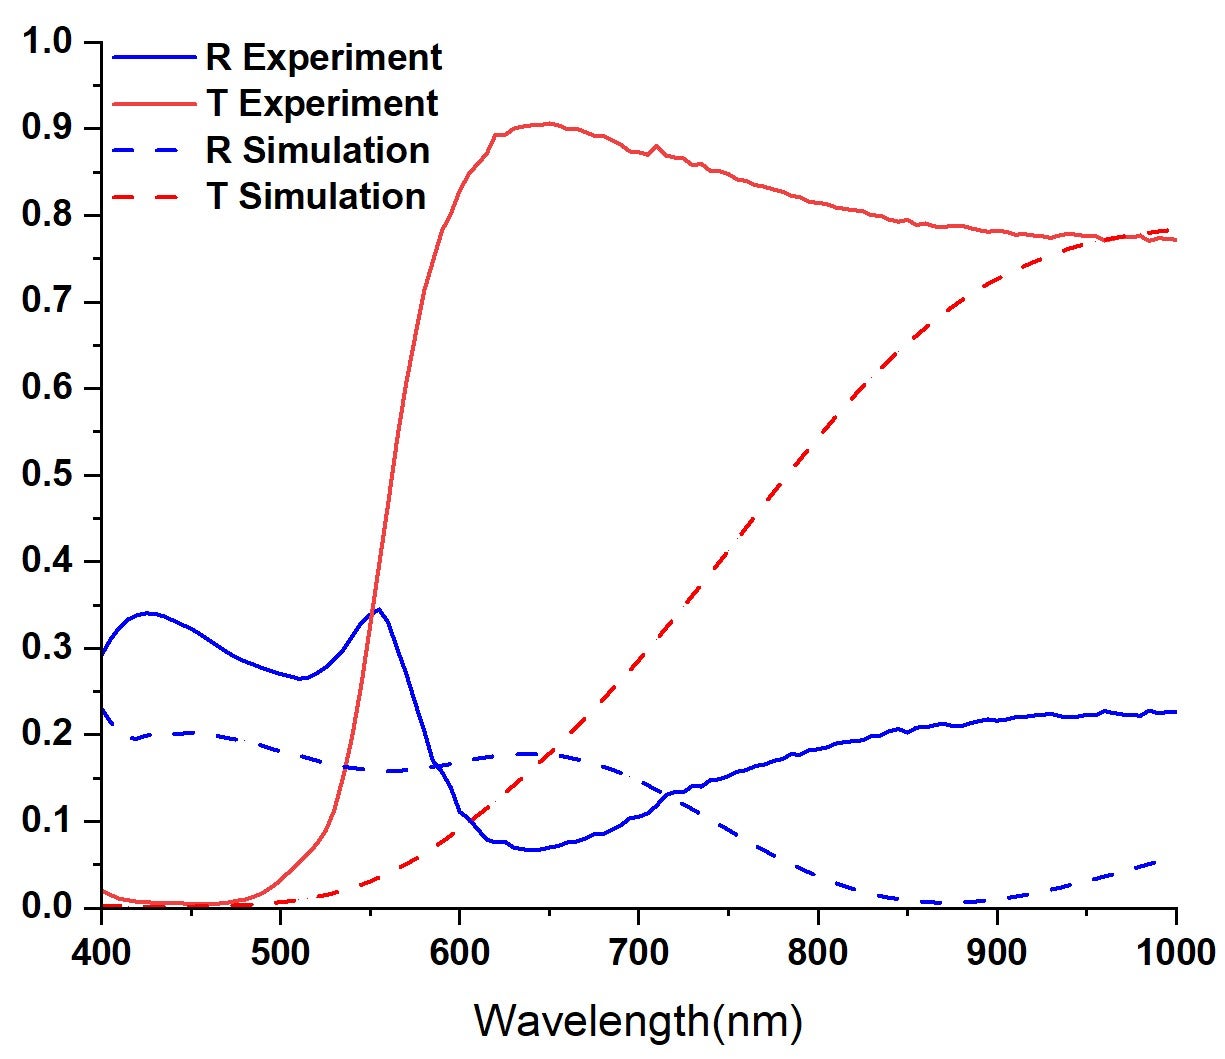
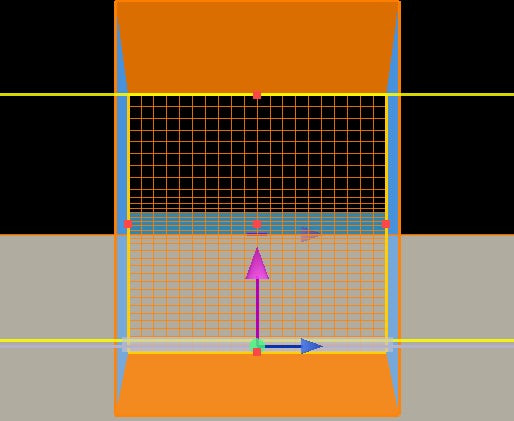
SubscriberRecently I use FDTD to simulate the transmission and reflection spectrum of a specical anisotropic material call Azo Dye, which is similar to Liquid crystal. Our team has measured its complex refraction index(CRI) (with nxx, nyy, nzz data in the material setting in FDTD)by ellipsometer before, so later I import the measured data straightly into the FDTD, but the transmission and reflection result in the FDTD shows a obvious difference at 500-600nm(as attached Fig. 1 shows) . In order to obtain the similar curve, I adjust the CRI in the FDTD at each wavelength. The model is based on the metasurface example in the official case library. The transmission and reflection monitor is based on the S parameter analysis group. Then I find the issues. When I want to change the CRI from 2.3 to 2.29 for a lower reflection, the result shows the reflection decreases sharply from 0.2 to 0.02, which is obviously impossible. This issue canbe solved by changing the position of T/R monitor, but when I go to the next wavelength with +5nm step, it happens again. Could you please tell me how it happens and how to handle this issues. I have tried to change the light source position and incident direction, substrate's refractive index, PML type, but nothing worked.
-
November 1, 2024 at 6:46 pm
-
- You must be logged in to reply to this topic.


-
4939
-
1639
-
1386
-
1242
-
1021

© 2026 Copyright ANSYS, Inc. All rights reserved.


