TAGGED: delta-error, hfss, impedance, s-parameters
-
-
August 6, 2021 at 1:48 pm
djihad-amina.djemmah
SubscriberHello,
I am simulating a 2D structure and I need to retrieve the S parameters in order to extract the effective parameters (refractive index, impedance, permittivity and permeability).
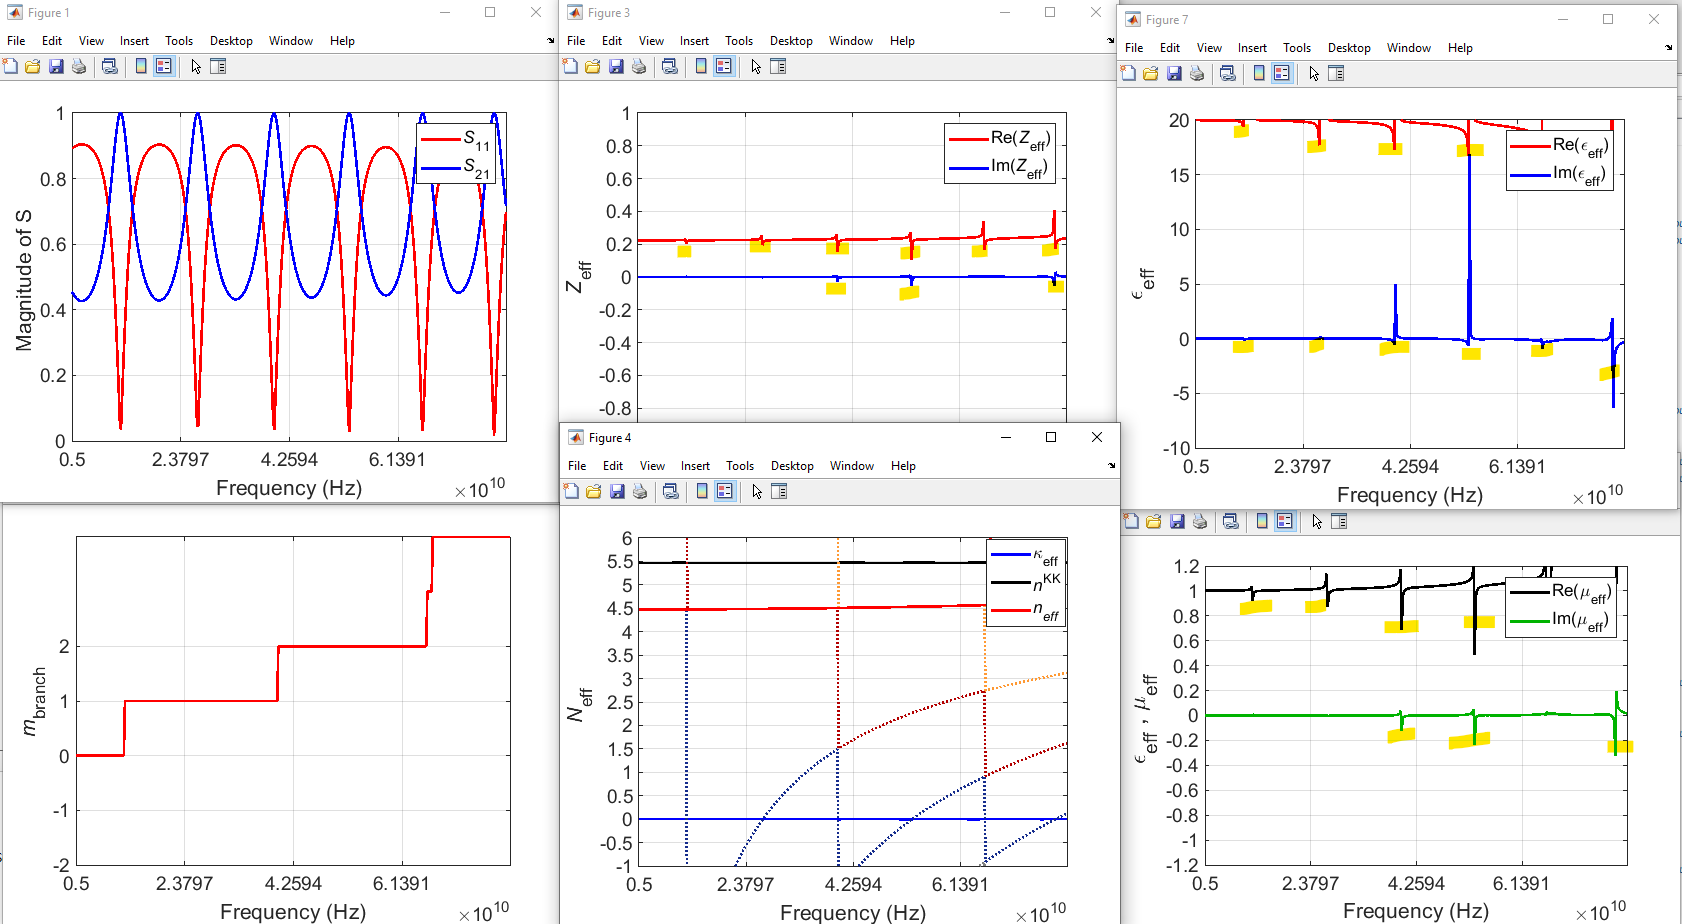
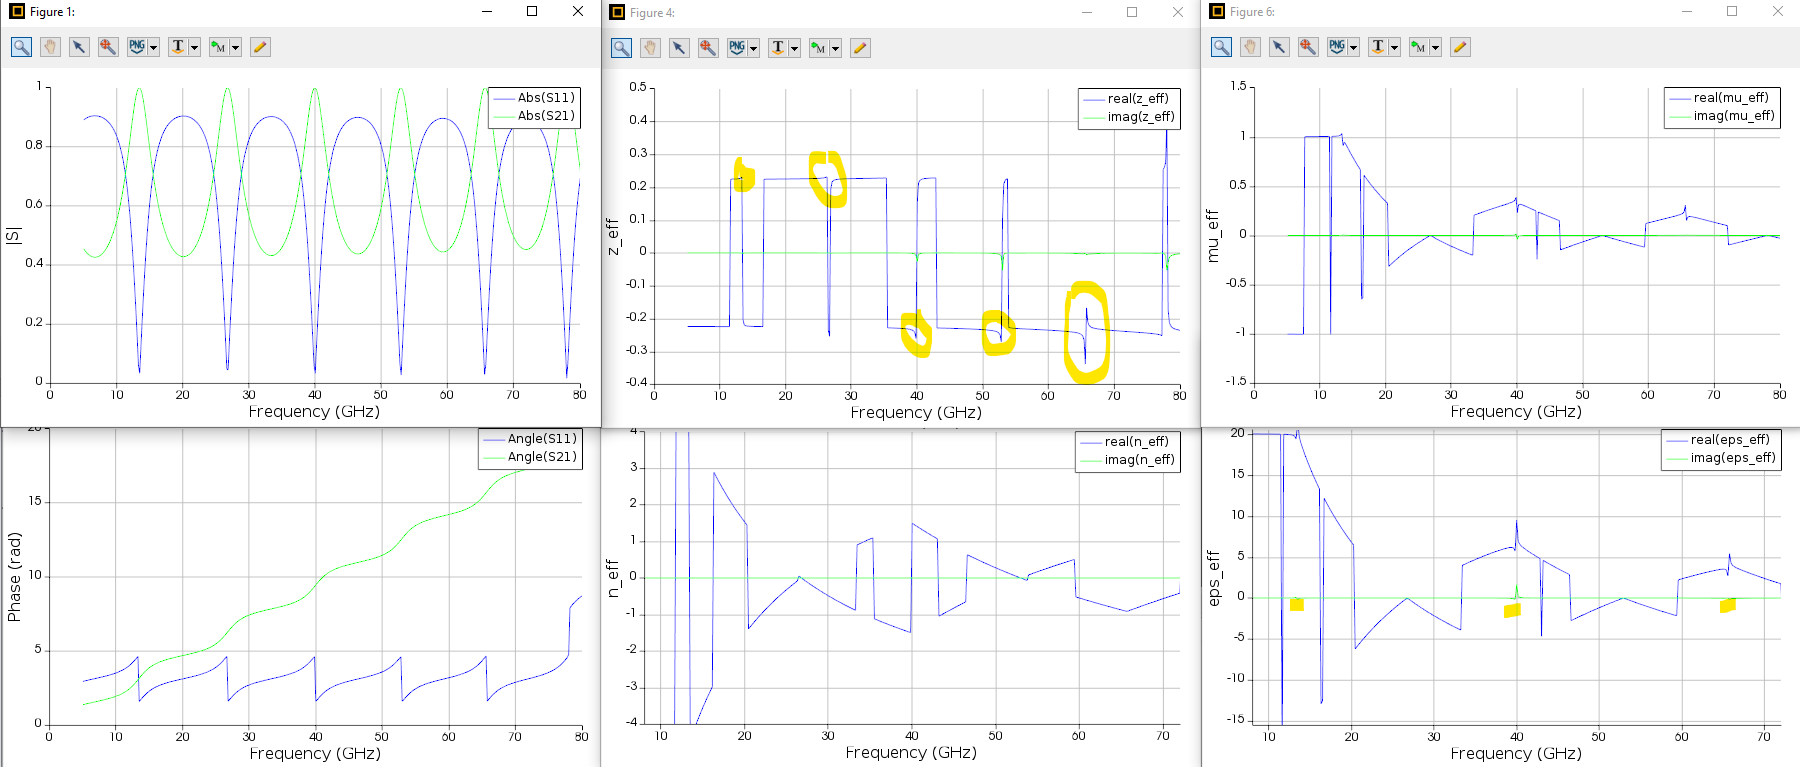
The problem I encounter when I extract the effective parameters, peaks without physical meaning appear on the impedance curve, these peaks appear when S21^2 is close to unity while S11 is close to 0.
To solve this problem with HFSS it is sufficient to decrease the delta S.
P.S HFSS uses the finite element method. It creates a mesh and then the process continues to calculate different parameters such as the diffusion parameter, vswr, etc. The difference between each pass is the delta S. To get maximum accuracy, we can decrease the delta S.
With lumerical, I tried to vary the mesh size as well as the simulation time but I could not solve the problem.
Can you please solve this problem and improve the accuracy of the simulation.
Looking forward to your answer.
August 9, 2021 at 8:26 amGreg Baethge
Ansys Employee
Thank you for posting your question on the forum. The accuracy of a FDTD simulation depends on many factors, the simulation time and mesh size being some of them. Some convergence testing should help to validate your simulation settings.
Could you give more information about your calculation? Are you using the examples from our application gallery? In any case, extracting the effective parameters is not trivial and the method we use, based on Smith et al, might not work for your case.
August 9, 2021 at 9:51 amdjihad-amina.djemmah
SubscriberThank you for your answer.
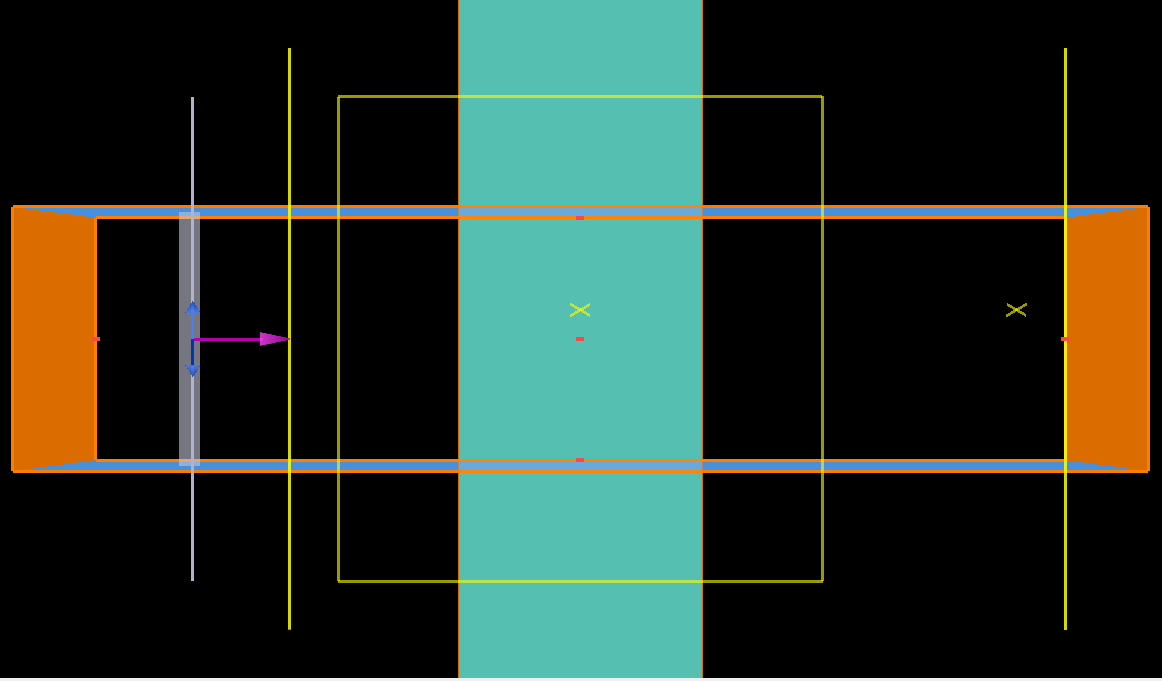
I simulate a 2D structure (2.5 mm of a dielectric material with n=4.47) in the 5-80GHz frequency range.
.

I use the S-parameters of the network to calculate the S-parameters .

To extract the effective parameters I used 2 methods :
The first one is the smith method, with this method I got fluctuations as you can in figure 3 + peaks at some frequencies.
I changed the method, and I used the Szabo method, here I didn't get any fluctuation, but I have peaks that correspond to the minima/maxima of the S parameters (figure 4).
August 9, 2021 at 9:53 amAugust 9, 2021 at 9:57 amdjihad-amina.djemmah
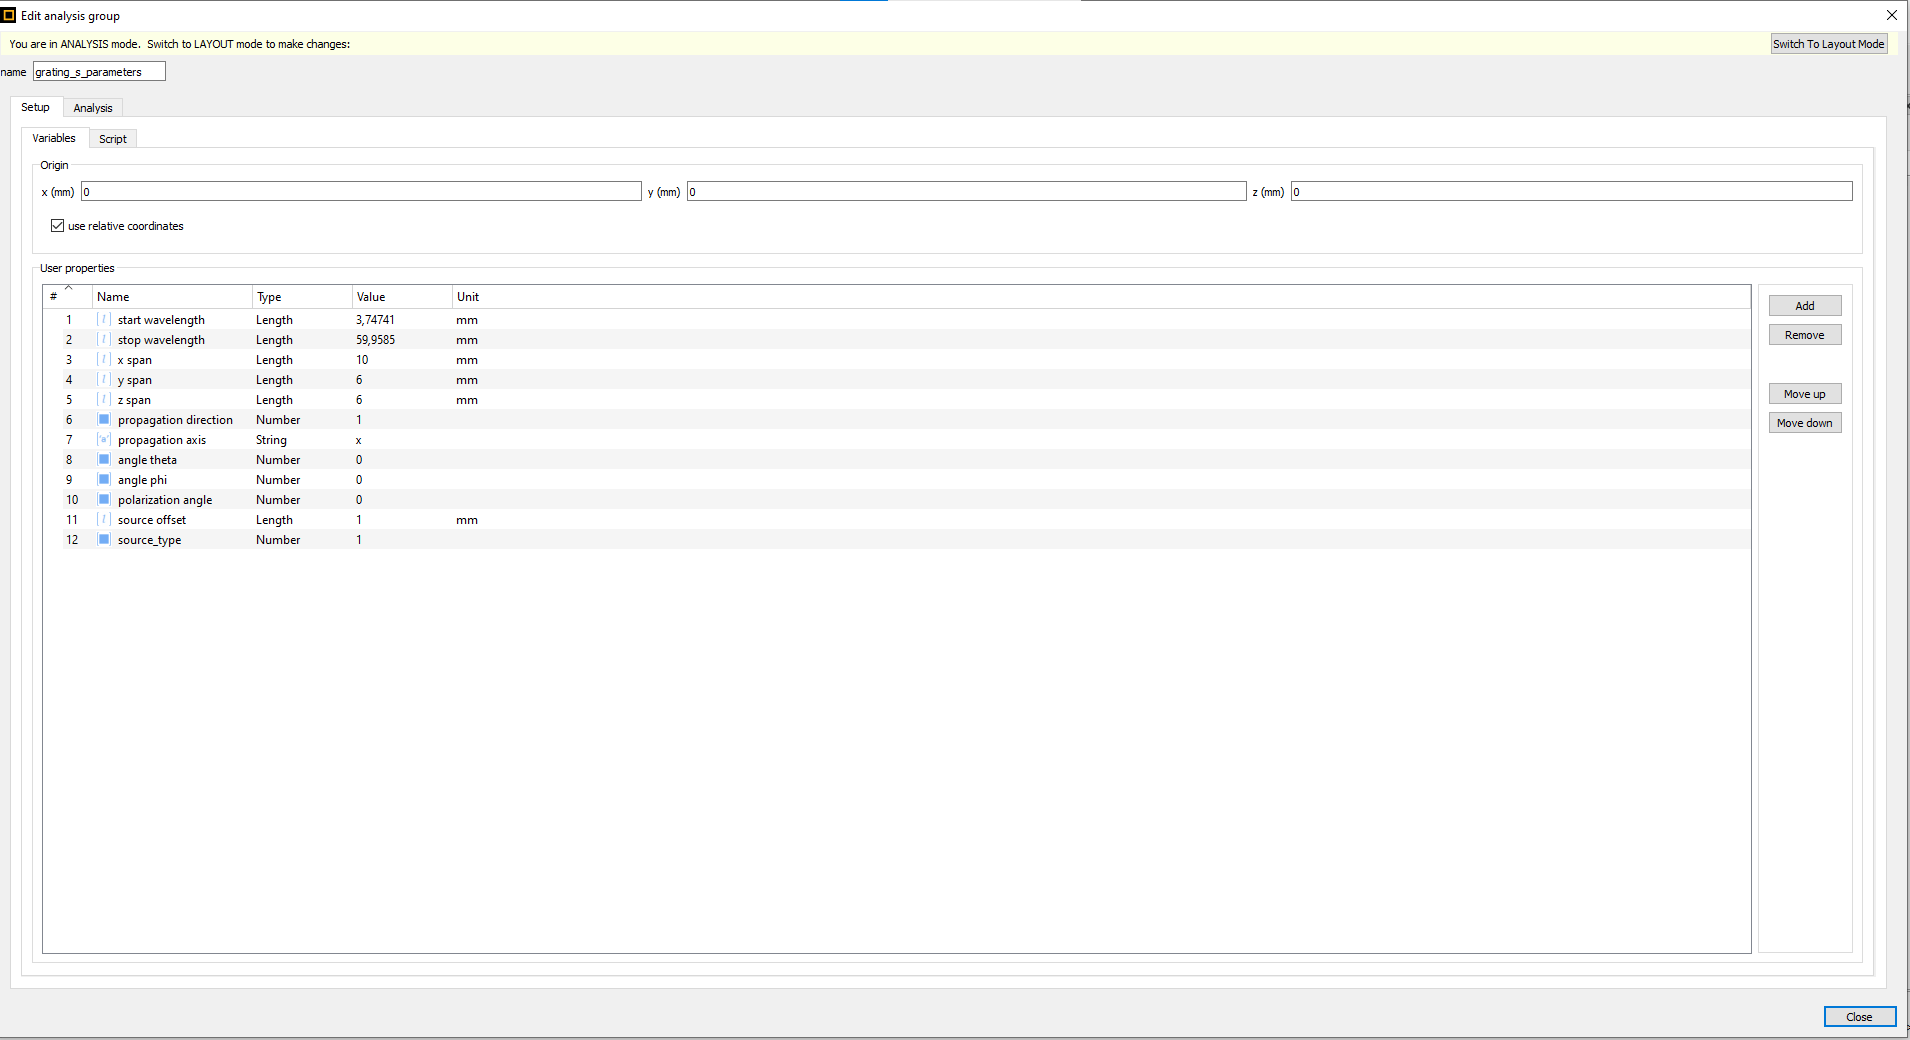
SubscriberI forgot to mention that , I also varied the number of layers of PML, and found the best result with 8 layers.
and the distance between the two monitors, and I found the best result with x span = 10mm.
August 9, 2021 at 4:23 pmGuilin Sun
Ansys EmployeePlease do not post duplicated questions in the forum.
August 10, 2021 at 7:29 amdjihad-amina.djemmah
SubscriberOK, sorry.
I was just trying to get a quick answer to my question.
Viewing 6 reply threads- The topic ‘S parameters’ is closed to new replies.
Innovation SpaceTrending discussionsTop Contributors-
4838
-
1587
-
1386
-
1242
-
1021
Top Rated Tags© 2026 Copyright ANSYS, Inc. All rights reserved.
Ansys does not support the usage of unauthorized Ansys software. Please visit www.ansys.com to obtain an official distribution.
-


