
TAGGED: example, experimental-results, microplane-model, validation
-
-
September 28, 2021 at 3:05 pm
MickMack
SubscriberHi,
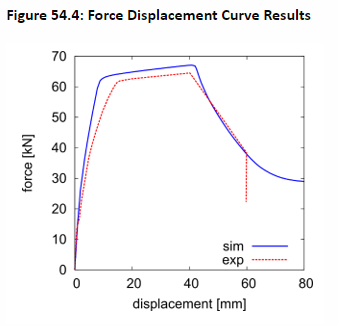
I have been trying to replicate Technology Showcase Example 54, based on Chalioriset al (2008), but it is not clear how ANSYS have validated example 54 against the experimental results. I have detailed the issue below, as the experimental results presented in fig54.4 don't appear in the published paper.
Thanks,
Michael
It is not clear from the study by Chalioriset al (2008), where the experimental F-D data in figure 54.4 comes from.
September 28, 2021 at 3:39 pmErKo
Ansys EmployeeI know you have asked this before, but unfortunately I do not have any idea where this validation f-d curve (fig. 54.4) comes from in TD54 example. Unfortunately I have not done this TD example so I can not provide any more help and details.
As I have said, when analysing RC structure (so when you do own real examples related to academic or other work, etc..) use the workflow I have referred to. That is the only advice I can give.
Thank you
Erik
September 28, 2021 at 4:02 pmSubscriberThanks for the reply Erik, some1 else maybe able to shed some light on this.
Cheers
Michael
September 28, 2021 at 7:43 pmSubscriberHi Folks
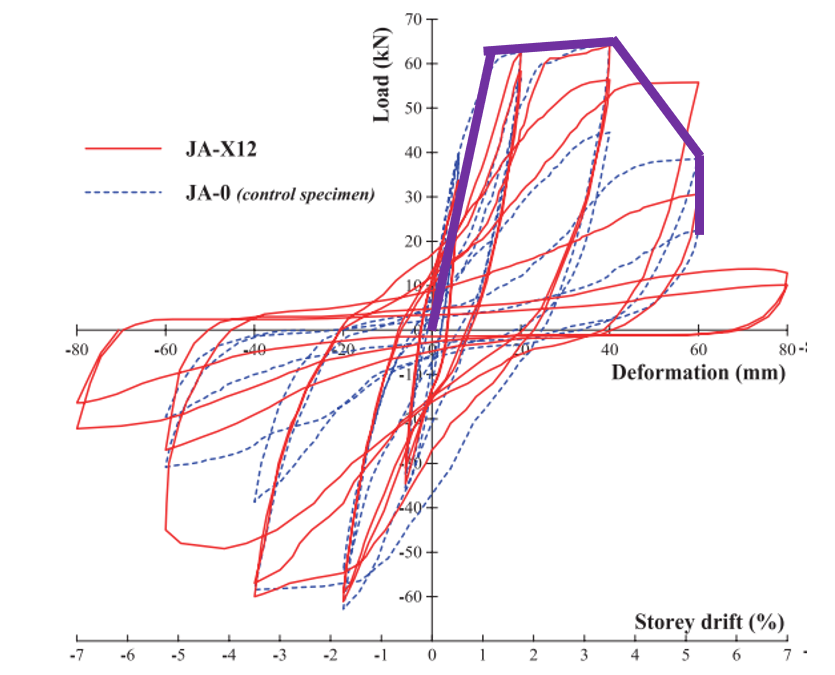
I have drawn the purple line over the hysteric response of the control specimen, and it appears to be the same curve as the experimental results used in Fig 54.4. Could anyone offer any insight into whether this is what was used in Techno example 54?? If so how can this be justified?
Thanks Michael
September 29, 2021 at 12:00 amBenjaminStarling
SubscriberShort answer - Yes, this is ok. Is it 100% accurate, no, but likely very close, provided the interpretation is correct.
Understanding force deflection curves.
In uni we are exposed to the usual stress strain curve to describe material properties such as Young's modulus, plasticity, strength, toughness, etc. There is then a disconnect to when you are taught hysteresis in your vibration or dynamics class. These things should really be taught with some reference to one another.
In figure 54.4 there are four distinct regions on the experimental curve, elastic region, plastic region, damage, failure. On the hysteresis curves we can identify the elastic and plastic regions, these are visible in every loop, in particular, the plasticity is responsible for transforming the hysteresis curves left and right. But what is responsible for transforming the hysteresis curves up and down? Damage to the structure is responsible for this, i.e. damage is responsible for a reduction in strength and toughness, it shrinks your stress strain curves, including the area underneath it.
Issues with this interpretation
As your JA-X12 curve shows, there is dependence on the load increment and load/displacement control applied in each hysteresis loop, let alone just variation between material/structural samples.
Where do you determine that failure occurs? Hysteresis curves are typically not taken to failure. They have assumed failure as the point where the hysteresis loop can't sustain any more deflection than the previous hysteresis loop. But from the JA-X12 curve we see the failure occurs later. This is related to the first point, but in particular I think the determination of failure is probably the most difficult. They probably could have just used figure 54.4 without the failure section, just terminate the plastic section.
September 29, 2021 at 2:57 pmSubscriberThanks very much for such a considered response. It is an interesting point you make.
It is difficult to draw a conclusion when we are only guessing the intention, but it doesn't seem logocal to validate the "gradient-enhanced coupled damage-plasticity microplane model" in this way in the very least.
Kind Regards Michael
September 29, 2021 at 10:38 pmSubscriberThat is an important distinction to make. This isn't about validating a material model specifically, this is about validating your model with the experiment. This applies specifically to this structure being loaded in this manner. I could make a similar case for any material model in this experiment, i.e. if I was only interested in the linear portion, I could validate my model using a linear elastic material model, provided I am not operating in the plastic or damage region. This is likely not the only configuration of a model that yields results in line with experiment. Slight modifications could be made to BC's, Loads, Material and Element types, as long as the model is validated against experiment, this is fine.
In example 54 there are recommendations that kind of cover this, stating that parameters can be tweaked to acheive better/different correlation. There are also many other material models with damage (although possibly not in APDL) that may be applicable.
Viewing 6 reply threads- The topic ‘Query regarding Validation of Technology Showcase Example 54 by ANSYS?’ is closed to new replies.
Innovation Space Trending discussions
 Top Contributors
-
peteroznewman
 6710
6710 -
scabo
 1906
1906 -
Dennis Chen
 1469
1469 -
javat33489
 1313
1313 -
Shyam Prasad V Atri
1022
Top Rated Tags
© 2026 Copyright ANSYS, Inc. All rights reserved.
Ansys does not support the usage of unauthorized Ansys software. Please visit www.ansys.com to obtain an official distribution.
-


The Ansys Learning Forum is a public forum. You are prohibited from providing (i) information that is confidential to You, your employer, or any third party, (ii) Personal Data or individually identifiable health information, (iii) any information that is U.S. Government Classified, Controlled Unclassified Information, International Traffic in Arms Regulators (ITAR) or Export Administration Regulators (EAR) controlled or otherwise have been determined by the United States Government or by a foreign government to require protection against unauthorized disclosure for reasons of national security, or (iv) topics or information restricted by the People's Republic of China data protection and privacy laws.
