-
-
May 4, 2024 at 3:37 pm
Logeshwaran Venkatesapandian
Subscriber -
May 6, 2024 at 5:24 pm
Guilin Sun
Ansys EmployeeI believe this is physical, as you can see even at small power, there is a kink at higher frequecy. when the power is small, the device works at the linear I-V relation. When the power is large other physics is involved.
To improve, please check if the material properties are properly set and all the physics are considered.
-
May 11, 2024 at 1:00 pm
Logeshwaran Venkatesapandian
SubscriberThank you very much for your response. we figure out that there is an optical power screening effect at a higher optical generation rate. In that case, the Electric field is reduced and the saturation velocity (Vsat) of photo generated carrier is reduced.
So, we want to plot Drift velocity vs Electric field to extract the saturation velocity to check this effect. Can you please tell me how we can do that? As shown in the below referred graph. Thank you.
-
-
- The topic ‘
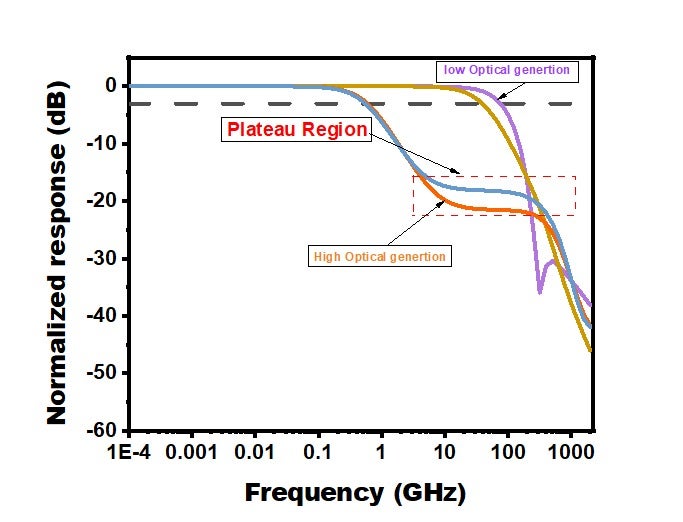
Problem with the plateau region for f3dB bandwidth measurement’ is closed to new replies.
- Difference between answers in version 2024 and 2017 lumerical mode solution
- Absorption cross-section of AuNR excited by prism-based TIR
- How to measure transmission coefficients on a given plane .
- 2D inverse design grating coupler
- Lumerical Python API Topology Optimization Error 2025 R1
- FDE : Simulation waveguides with electrodes
- Loss of lithium niobate phase modulator
- Lumerical Interconnect: how to implement an electronic feedback?
-
2713
-
959
-
813
-
599
-
591
© 2025 Copyright ANSYS, Inc. All rights reserved.