-
-
November 7, 2023 at 8:53 am
murali
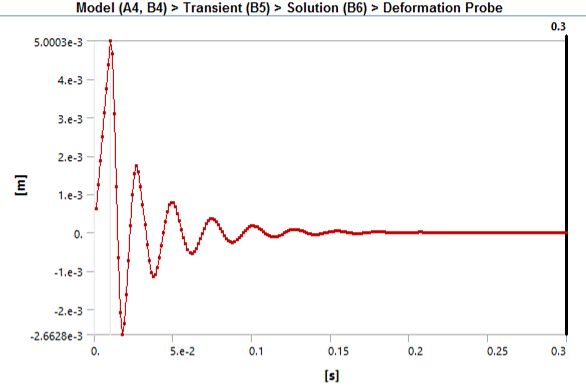
SubscriberThis is the displacement probe plot for the free end of a cantilever beam subject to an initial displacement of 5e-3 m. I did this as a 2 step analysis. I have two questions:
- How should I adjust the analysis settings so that I get the displacement 5e-3 at time 0 (as it is not possible to keep the step end time as 0?) ? Or is there some way to adjust the plot once the analysis is done?
- How do i get rid of the points on the curve so that I have a smooth curve?
Thanks In advance.
-
November 7, 2023 at 1:24 pm
Erik Kostson
Ansys EmployeeHi
Answer to both questions is: copy the data from the displacement probe, and paste into excel and change the values as needed so they start from when you want – when plotting there you can choose a curve with no dots at the plotted values (so line only graph, dots only etc.).
All the best
Erik
-
November 8, 2023 at 9:30 am
murali
SubscriberThanks you Erik.
-
-
Viewing 1 reply thread
- The topic ‘Post Processing in transient analysis’ is closed to new replies.
Ansys Innovation Space


Trending discussions


Top Contributors


-
3467
-
1057
-
1051
-
918
-
896
Top Rated Tags


© 2025 Copyright ANSYS, Inc. All rights reserved.
Ansys does not support the usage of unauthorized Ansys software. Please visit www.ansys.com to obtain an official distribution.


