TAGGED: fluent, fluent-cfd, fluent-post-processing
-
-
February 28, 2021 at 4:47 am
jesonwilsonj
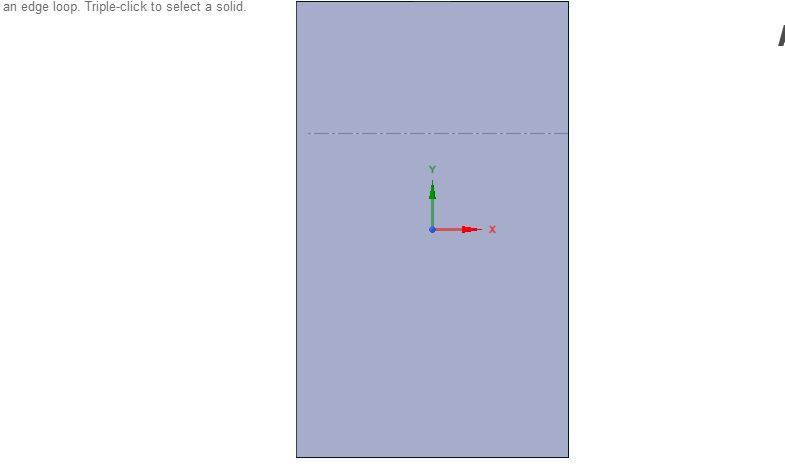
SubscriberI have modelled a copper sheet with copper tubes underneath it and in contact with copper sheet. The water is flowing through the copper tubes through an inlet and comes out through an outlet. There is layer of glass above the copper sheet.
This model is running in an environment of 31 deg C and inlet water temperature of 10 degC. The mass flow rate of the water is 2 l/min and is assumed to be constant. The whole system is running for 1 hour. I simulated this setup in ANSYS Fluent 2019 R2.
I want to plot the Time Vs Temperature graph at certain selected points on the copper sheet to estimate the temperature variation at different points of the panel over a period of time.
I tried creating the graph in CFD Post but I am not getting the correct graph. I am getting a straight linear graph from 31 degC to 10 degC.
I have posted different views of the SolidWorks Model for better understanding of the setup. Also, I have posted the graph I obtained in CFD-Post.
Could anyone tell me what is the problem?
March 1, 2021 at 2:16 pmKarthik Remella
AdministratorHello,nWhat initial values are you using in your simulation?nAre you running a transient model? What are your boundary conditions on the walls of the copper tube?nWhat is your time-step and is your simulation converging every time step?nWhat viscous model did you use to simulate this flow (and heat transfer)?nKarthiknMarch 1, 2021 at 3:22 pmYasserSelima
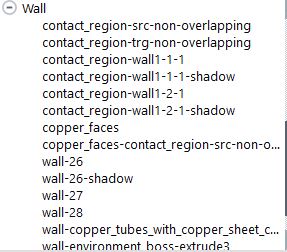
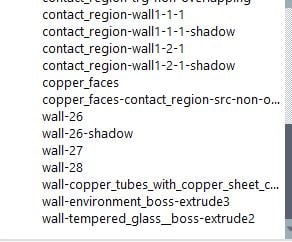
SubscriberBefore running the simulation, define a report definition and select write to file. nMarch 2, 2021 at 8:27 amSubscriberHi Karthik,n Thanks for the reply. I am using Standard Initialization. I selected in the Compute from option all Zones and gave a temperature of 31 degC. Because my setup is at 31 degC and the operation begins from 31 degC. nI am using a transient Solver. I am solving for a time step size of 3600 seconds and the number of time steps is 1. The number of iterations is 10. Can u tell how do I know if I have converged my solution? I have provided the Scaled residuals of my simulation below.n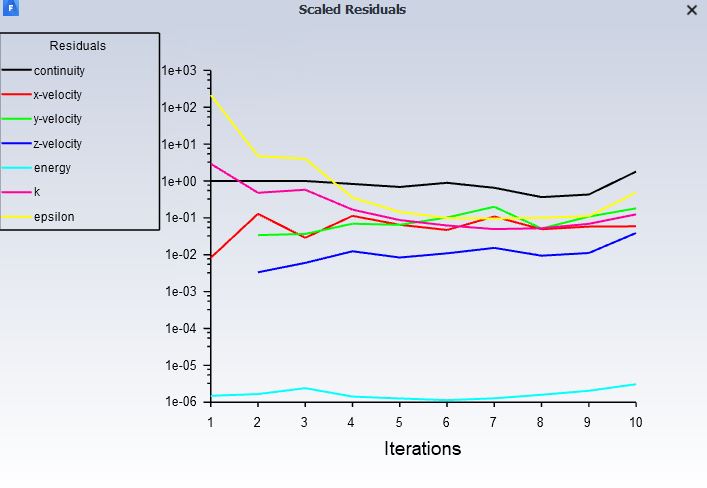 nMy Boundary's consists of contact regions, walls, interiors, inlets and outlets. I have applied a temperature of 31 degC for the environment. I have created a box around my setup which is my environment and have assigned material properties of air. The 31 deg C I have applied on the wall of this box. nThen I have inputted the temperature and mass flow rate for inlet and outlet. I have used mass flow inlet and mass flow outlet as my boundary condition here.nThe rest of the boundary conditions I have left it untouched.nI used k-epsilon viscous model for my simulation.nI have given a list of my boundary conditions as an image here.n
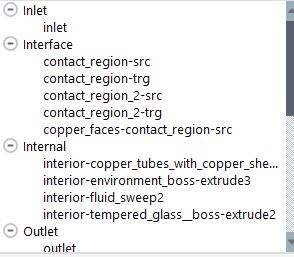
 n
March 2, 2021 at 8:33 amSubscriberHi Yasser Selima,nI tried using the Report Definitions option. But when I am trying to create a new definition, there is no option for Time Vs Temperature. There is only three options.nMass Flow rate nTotal Heat Transfer ratenRadiation Heat Transfer RatenMarch 2, 2021 at 11:47 am
n
March 2, 2021 at 8:33 amSubscriberHi Yasser Selima,nI tried using the Report Definitions option. But when I am trying to create a new definition, there is no option for Time Vs Temperature. There is only three options.nMass Flow rate nTotal Heat Transfer ratenRadiation Heat Transfer RatenMarch 2, 2021 at 11:47 amRob
Forum ModeratorYou need to create a new report, right click on the menu, or have a look through the tutorials (click on Help) as we use them frequently. nMarch 14, 2021 at 5:33 amSubscriberHi,nCan anyone help me provide an answer for above discussion? ThanksnI have modelled a copper sheet with copper tubes underneath it and in contact with copper sheet. The water is flowing through the copper tubes through an inlet and comes out through an outlet. There is layer of glass above the copper sheet.This model is running in an environment of 31 deg C and inlet water temperature of 10 degC. The mass flow rate of the water is 2 l/min and is assumed to be constant. The whole system is running for 1 hour. I simulated this setup in ANSYS Fluent 2019 R2. I want to plot the Time Vs Temperature graph at certain selected points on the copper sheet to estimate the temperature variation at different points of the panel over a period of time.I tried creating the graph in CFD Post but I am not getting the correct graph. I am getting a straight linear graph from 31 degC to 10 degC. I have posted different views of the SolidWorks Model for better understanding of the setup. Also, I have posted the graph I obtained in CFD-Post.Could anyone tell me what is the problem?https://us.v-cdn.net/6032193/uploads/5956DFVPOY0R/copper-sheet-with-copper-tubes-jpg.jpghttps://us.v-cdn.net/6032193/uploads/C699MEU9FEMN/copper-sheet-with-copper-tubes1-jpg.jpghttps://us.v-cdn.net/6032193/uploads/RRI28XC2CNCS/inlet-with-interface-between-copper-sheet-and-copper-tube-jpg.jpghttps://us.v-cdn.net/6032193/uploads/UG1MAXC1VIDH/graph-jpg.jpg/forum/discussion/24981/plotting-time-vs-temperature-graph-for-copper-sheet-with-copper-tubes-cooled-with-cooling-water
nMarch 15, 2021 at 12:26 pmForum ModeratorYou need to create a Report Definition (look in the tree in the Solution section) for temperature for each point of interest in Fluent. Then run the calculation. If you set up the monitors correctly (see the tutorials for examples) you'll see the plot of temp v time and if you tick the write to file option you'll get text files written out too. nViewing 7 reply threads- The topic ‘Plotting Time Vs Temperature graph for copper sheet with copper tubes cooled with cooling water’ is closed to new replies.
Innovation Space Trending discussions
 Top Contributors
-
peteroznewman
 6144
6144 -
scabo
 1906
1906 -
Dennis Chen
 1442
1442 -
javat33489
 1308
1308 -
Shyam Prasad V Atri
1022
Top Rated Tags
© 2026 Copyright ANSYS, Inc. All rights reserved.
Ansys does not support the usage of unauthorized Ansys software. Please visit www.ansys.com to obtain an official distribution.
-