TAGGED: fluent, journal-file, partition, tui
-
-
October 29, 2021 at 8:56 ambujarpSubscriber
I used tihs command in TUI to try a partition without going to different zones.
/parallel/partition/method/principal-axes 40
/parallel/partition/set/across-zones
After the second commant Fluent says that with Metis it isn't possible to change across zones, allthough I used the command before.
I want to try, if disabling across zones can lead to better simulation time.
Thank you
October 29, 2021 at 10:19 amRobForum ModeratorIt's unlikely to help, but will depend on the rest of the model. How many cells have you got, and how many zones? Are those zones moving?
October 29, 2021 at 10:36 ambujarpSubscriber16 cell zones. There are two sliding meshes and also periodic boundaries. Maybe the a partition boundary, which is cutting the rotational zone can lead to large communication time?
Mesh Info:218718 nodes and 1110183 elements. My question was more about the TUI.
Thanks anyway
October 29, 2021 at 11:12 amRobForum ModeratorWith around 1 million cells and non-conformals for sliding mesh I'd not go over about 10 partitions for efficient use of the cores. You'll still see speed up beyond that.
Re the two commands, why are you partitioning and then setting the partition across boundaries? Also, whilst journals are very powerful it's usually easier to set up a model locally, partition manually and then send it off to the cluster to run.
October 29, 2021 at 11:26 ambujarpSubscriber
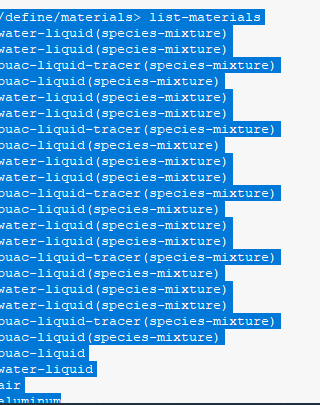
Thanks. There is also another problem that the if I simulate with 1 Node(20 tasks per node--> so 20 partitions) I get this error message:
==============================================================================
===================================================================================
=BAD TERMINATION OF ONE OF YOUR APPLICATION PROCESSES
=PID 4882 RUNNING AT cstd02-049
=EXIT CODE: 9
=CLEANING UP REMAINING PROCESSES
=YOU CAN IGNORE THE BELOW CLEANUP MESSAGES
===================================================================================
Intel(R) MPI Library troubleshooting guide:
https://software.intel.com/node/561764
=====
When simulating with one node it uses too much memory:
> timekbmemused
> 10:40:01 AM11605588
> 10:50:01 AM14114168
> 11:00:01 AM16619788
> 11:10:01 AM18385440
> 11:20:01 AM20677200
> 11:30:01 AM22551200
> 11:40:01 AM24563312
> 11:50:01 AM27044424
> 12:00:01 PM28601752
> 12:10:02 PM30850688
> 12:20:01 PM32915072
> 12:30:01 PM35065452
> 12:40:01 PM36657816
> 12:50:01 PM38874056
> 01:00:01 PM41414584
> 01:10:01 PM43445944
> 01:20:01 PM44990388
> 01:30:01 PM47385076
> 01:40:01 PM49660092
> 01:50:01 PM51335148
> 02:00:01 PM53959052
> 02:10:01 PM56032252
> 02:20:01 PM58121960
> 02:30:01 PM59675572
> 02:40:01 PM61839556
Then there is not ennough RAM availlable for that problem.
If i simulate with 2Nodes (40 partitions) the simulation is running fine.
I very appreciate your help.
October 29, 2021 at 1:40 pmRobForum ModeratorWhat solver models have you got turned on? 1M cells shouldn't use much more than 3GB RAM unless you're running chemistry or multiphase.
October 29, 2021 at 1:45 pmbujarpSubscriberIt is multiphase Eulerian model. For turbulence I used mixture Real. kepsilon model.
October 29, 2021 at 2:40 pmRobForum ModeratorHow many phases?
October 29, 2021 at 2:48 pmbujarpSubscriberTwo
November 1, 2021 at 1:19 pmRobForum Moderator2 phase Euler with no chemistry shouldn't need any more than 4GB RAM, so I'm not sure why it's failing. Can you get more info from IT to see if it's something on their side.
November 2, 2021 at 8:35 ambujarpSubscriberI talked with someone from IT but he said it has more something to do with Fluent. There is also one thing in Fluent, which I want to ask, because you talked about chemistry:
The species model in Fluent is deactivated, nevertheless I get the Warnings:
Warning: Create_Material: (water-liquid . species-mixture) already exists
and
Warning: Create_Material: (buac-liquid-tracer . species-mixture) already exists
around 30 times. That's because I wanted to activate the species model but then deactivated it again. But the problem with the simulation time was also present before I think.
November 2, 2021 at 11:28 amRobForum ModeratorA repeat like that tends to be parallel nodes trying to open something. If you turned species off, the mixture should be kept in the case but isn't available as an option. I have seen another case with stuck phase/species and wonder if you've glitched the scheme call when turning the model off. Check what species are present in the materials and see what is used in the cell zone(s).
November 2, 2021 at 11:59 amNovember 2, 2021 at 2:06 pmRobForum ModeratorNot sure, there's something not set up correctly somewhere. How many materials are there?
November 2, 2021 at 2:51 pmNovember 2, 2021 at 4:13 pmRobForum ModeratorSomething's very scrambled in the case. It's probably recoverable but it'll be quicker for you to rebuild from the mesh file.
November 18, 2021 at 3:04 pmbujarpSubscriberHello It's me again. I still have the same problems with the too long simulation time. I use periodic boundaries with periodic repeats and sliding mesh. Any ideas? That#s the only problem I have now. The thing with the species models is resolved. I only have two phases there. The periodic offset is 120 degree.
November 18, 2021 at 5:24 pmRobForum ModeratorDefine "too long", CFD runs typically take hours or even weeks depending on what you're modelling.
November 19, 2021 at 7:26 ambujarpSubscriber9 hours for 1 second simulation time (timestep=0.001s; no. of timesteps 1000).
Two sliding meshes
I use a HPC cluster. I simulate 2 Nodes with one task per node. I don't know why it takes so long.
I use Eulerian apprach two phases and the real. k- epsilon model.
November 19, 2021 at 7:38 ambujarpSubscriberI simulate with ca. 1 Mio cells
November 19, 2021 at 7:43 ambujarpSubscriberThats the file for the cluster starting the job
#!/bin/bash -l
#SBATCH --job-name 181121_2
#SBATCH --partition=long
#SBATCH --time 18:00:00
##SBATCH --exclusive
#SBATCH --constraint="[cstd01|cstd02]"
#SBATCH --mem=60000
#SBATCH --nodes=2
#SBATCH --ntasks-per-node=20
#SBATCH -e error_file.e
#SBATCH -o output_file.o
## Gather the number of nodes and tasks
numnodes=$SLURM_JOB_NUM_NODES
numtasks=$SLURM_NTASKS
mpi_tasks_per_node=$(echo "$SLURM_TASKS_PER_NODE" | sed -e 's/^\([0-9][0-9]*\).*$/\1/')
## store hostname in txt file
srun hostname -s > slurmhosts.$SLURM_JOB_ID.txt
## calculate slurm task count
if [ "x$SLURM_NPROCS" = "x" ]; then
if [ "x$SLURM_NTASKS_PER_NODE" = "x" ];then
SLURM_NTASKS_PER_NODE=1
fi
SLURM_NPROCS=`expr $SLURM_JOB_NUM_NODES \* $SLURM_NTASKS_PER_NODE`
fi
export OMP_NUM_THREADS=1
export I_MPI_PIN_DOMAIN=omp:compact # Domains are $OMP_NUM_THREADS cores in size
export I_MPI_PIN_ORDER=scatter # Adjacent domains have minimal sharing of caches/sockets
# Number of MPI tasks to be started by the application per node and in total (do not change):
np=$[${numnodes}*${mpi_tasks_per_node}]
# load necessary modules
module purge
module add intel/mpi/2019.1
module add fluent/2021R1
# run the fluent simulation
fluent 3ddp -ssh -t$np -mpi=intel -pib -cnf=slurmhosts.$SLURM_JOB_ID.txt -g -i journal.jou
# delete temp file
rm slurmhosts.$SLURM_JOB_ID.txt
November 19, 2021 at 1:25 pmRobForum ModeratorSo 20k iterations in 9 hours on 2 cores. Try using 4 cores. You also need to review the mesh resolution down the gaps.
November 19, 2021 at 3:54 pmAmine Ben Hadj AliAnsys EmployeeSo it takes 32.4 seconds for one time step. Can you very the parallel timer usage as well as the memory usage in Fluent say after running one time step, then after running 10 time steps then after running 100 time steps. Which models are involved in this case?
November 20, 2021 at 10:45 pmbujarpSubscriberWhich gap do you mean? Between the compartments? Could this affect the simulation speed for parallel use? I use a HPC linux cluster by the way so these are 2x20 tasks. If I use more than it iterates faster but between timestep it lasts longer. I export data as cdat and has turned on legacy-mode
I use eulerian two phase with schiller naumann drag and real. K epsilon model. Sliding mesh and periodic boundaries. How can I vary parallel timer and memory usage? I am not an expert in parallel computing.
Here some information from cluster:
Nodes: 2Cores per node: 20CPU Utilized: 10-01:37:29CPU Efficiency: 47.79% of 21-01:37:20 core-walltimeJob Wall-clock time: 12:38:26Memory Utilized: 11.40 GBMemory Efficiency: 9.73% of 117.19 GB
Thanks
November 22, 2021 at 8:45 amRobForum ModeratorIf you look at the mesh there are a few regions with around 4 cells between the walls, this will make convergence more difficult (especially with multiphase) and that may then slow down the runs. If you're getting 47% efficiency, check what else is going on. With the newer high core count chips we're finding the interconnect isn't sufficient to get a good scale up. You don't vary the parallel settings other than, potentially, load balancing, you report them and check how they're doing.
November 23, 2021 at 7:53 ambujarpSubscriberBy the way something comes to my mind. At the beginning of setting up the simulation I changed the default option I/O into legacy. Could this also affect the simulation performance?
November 23, 2021 at 11:51 amRobForum ModeratorIf you're messing with the data transfer and it's not optimal for your system it can slow things down. You'd need to test that by running a comparison.
November 24, 2021 at 7:52 ambujarpSubscriberCan you interpret this one:
I simulated with 1x20 and from the cluster I got "Out of memory"
Writing to cstd01-027:"/work/smbupash/Simulationen/f1/Sim_231121/cff/F:Twophase_filesdp0FFF-4FluentSYS-10.1.gz-1-05010.dat.h5" in NODE0 mode and compression level 1 ...
Writing results.
Done.
Create new project file for writing: F:Twophase_filesdp0FFF-4FluentSYS-10.1.flprj
Flow time = 5.01s, time step = 5010
> /report/system/proc-stats
------------------------------------------------------------------------------
| Virtual Mem Usage (GB)| Resident Mem Usage(GB)|
ID| CurrentPeak| CurrentPeak| Page Faults
------------------------------------------------------------------------------
host| 0.7026560.703545| 0.1476750.147831| 52
n0| 2.625652.68926| 0.6078070.663673| 4
n1| 1.325341.3821| 0.5397030.589298| 5
n2| 1.314021.37231| 0.5433810.594231| 4
n3| 1.301141.35903| 0.5167920.567451| 6
n4| 1.406621.46503| 0.6199990.671329| 4
n5| 1.491421.54531| 0.7132840.760124| 7
n6| 1.452511.50829| 0.6714780.720135| 4
n7| 1.501031.5543| 0.7229230.769131| 4
n8| 1.478711.53541| 0.7015840.751091| 6
n9| 1.428961.48609| 0.6501390.700298| 7
n10| 1.455511.50975| 0.6790280.730106| 6
n11| 1.367121.42463| 0.583050.633049| 8
n12| 1.360971.41958| 0.5774080.628609| 6
n13| 1.471251.5276| 0.6918790.741177| 6
n14| 1.435461.49341| 0.6563760.707226| 6
n15| 1.452841.50963| 0.6718370.721519| 7
n16| 1.476831.53063| 0.6991580.745834| 4
n17| 1.456641.51338| 0.6789820.728443| 8
n18| 1.466091.5221| 0.6926380.741356| 7
------------------------------------------------------------------------------
| Virtual Mem Usage (GB)| Resident Mem Usage(GB)|
ID| CurrentPeak| CurrentPeak| Page Faults
------------------------------------------------------------------------------
n19| 1.47161.52944| 0.6963310.746979| 3
------------------------------------------------------------------------------
Total| 30.442431.5808| 13.061514.0589| 164
------------------------------------------------------------------------------
------------------------------------------------------------------------------------------------
| Virtual Mem Usage (GB)| Resident Mem Usage(GB)| System Mem (GB)
Hostname| CurrentPeak| CurrentPeak|
------------------------------------------------------------------------------------------------
cstd01-027| 30.442431.5808| 13.061614.0589| 62.8254
------------------------------------------------------------------------------------------------
Total| 30.442431.5808| 13.061614.0589|
------------------------------------------------------------------------------------------------
> /report/system/sys-stats
---------------------------------------------------------------------------------------
| CPU| System Mem (GB)
Hostname| Sock x Core x HTClock (MHz) Load| TotalAvailable
---------------------------------------------------------------------------------------
cstd01-027| 2 x 10 x 12599.9520.02| 62.825446.3037
---------------------------------------------------------------------------------------
Total| 20--| 62.825446.3037
---------------------------------------------------------------------------------------
> /report/system/time-stats
---------------------------------------------
| CPU Time Usage (Seconds)
ID| UserKernelElapsed
---------------------------------------------
host| 132-
n0| 32715-
n1| 32028-
n2| 32326-
n3| 32127-
n4| 32029-
n5| 32327-
n6| 32128-
n7| 32326-
n8| 32227-
n9| 32227-
n10| 32224-
n11| 32027-
n12| 32423-
n13| 32127-
n14| 32226-
n15| 32227-
n16| 32227-
n17| 32029-
n18| 32326-
---------------------------------------------
| CPU Time Usage (Seconds)
ID| UserKernelElapsed
---------------------------------------------
n19| 32326-
---------------------------------------------
Total| 6454524-
---------------------------------------------
Model Timers (Host)
Flow Model Time:1.381 sec (CPU), count 119
Other Models Time:0.013 sec (CPU)
Total Time:1.394 sec (CPU)
Model Timers
Flow Model Time:203.934 sec (WALL),204.341 sec (CPU), count 119
Turbulence Model Time:17.451 sec (WALL),17.436 sec (CPU), count 119
Other Models Time:3.464 sec (WALL)
Total Time:224.849 sec (WALL)
Performance Timer for 119 iterations on 20 compute nodes
Average wall-clock time per iteration:2.032 sec
Global reductions per iteration:376 ops
Global reductions time per iteration:0.000 sec (0.0%)
Message count per iteration:14376 messages
Data transfer per iteration:174.284 MB
LE solves per iteration:4 solves
LE wall-clock time per iteration:0.788 sec (38.8%)
LE global solves per iteration:1 solves
LE global wall-clock time per iteration:0.002 sec (0.1%)
LE global matrix maximum size:254
AMG cycles per iteration:4.252 cycles
Relaxation sweeps per iteration:227 sweeps
Relaxation exchanges per iteration:0 exchanges
LE early protections (stall) per iteration:0.000 times
LE early protections (divergence) per iteration:0.000 times
Total SVARS touched:386
Time-step updates per iteration:0.08 updates
Time-step wall-clock time per iteration:0.110 sec (5.4%)
Total wall-clock time:241.862 sec
> /exit Can't write .flrecent file
[Hit ENTER key to proceed...]
November 24, 2021 at 8:26 amAmine Ben Hadj AliAnsys EmployeeBut it wrote the file right? At least the system memory is bit larger than the required memory.
November 24, 2021 at 8:51 ambujarpSubscriberIt seems to be right for 10 timesteps. But don't know why the cluster says it is out of memory.
What does "> /exit Can't write .flrecent file
[Hit ENTER key to proceed...]" mean? Is it important?
November 24, 2021 at 8:54 amAmine Ben Hadj AliAnsys Employeecheck which home directory it is referring to and that there you plenty of space left.
November 24, 2021 at 9:01 ambujarpSubscriberThere is enough space. I also got this error message "slurmstepd: error: Detected 1 oom-kill event(s) in step 20476762.batch cgroup. Some of your processes may have been killed by the cgroup out-of-memory handler."
November 24, 2021 at 9:03 amAmine Ben Hadj AliAnsys EmployeeI think the latter has more with your Scheduler and Load Manager and not with Ansys Fluent.
Do all users experience the same issue with writing the flrecent file?
November 24, 2021 at 11:45 ambujarpSubscriberDon't know. But I had this report with the .flrecent-file also in other simulations. So I guess it is has nothing to do with the memory error.
November 24, 2021 at 11:55 amRobForum ModeratorCheck the .trn file from Fluent. That may report something useful. As says, that looks like a cluster issue more than something Fluent's doing.
October 19, 2022 at 10:43 amBetina JessenSubscriberViewing 35 reply threads- The topic ‘Partitioning with journal file’ is closed to new replies.
Ansys Innovation SpaceTrending discussions- How do I get my hands on Ansys Rocky DEM
- Non-Intersected faces found for matching interface periodic-walls
- Fluent fails with Intel MPI protocol on 2 nodes
- Unburnt Hydrocarbons contour in ANSYS FORTE for sector mesh
- Help: About the expression of turbulent viscosity in Realizable k-e model
- Cyclone (Stairmand) simulation using RSM
- Mass Conservation Issue in Methane Pyrolysis Shock Tube Simulation
- Script Error
- Facing trouble regarding setting up boundary conditions for SOEC Modeling
- convergence issue for transonic flow
Top Contributors-
1602
-
602
-
599
-
591
-
366
Top Rated Tags© 2025 Copyright ANSYS, Inc. All rights reserved.
Ansys does not support the usage of unauthorized Ansys software. Please visit www.ansys.com to obtain an official distribution.
-