-
-
August 25, 2023 at 3:41 pm
Brian Lolley
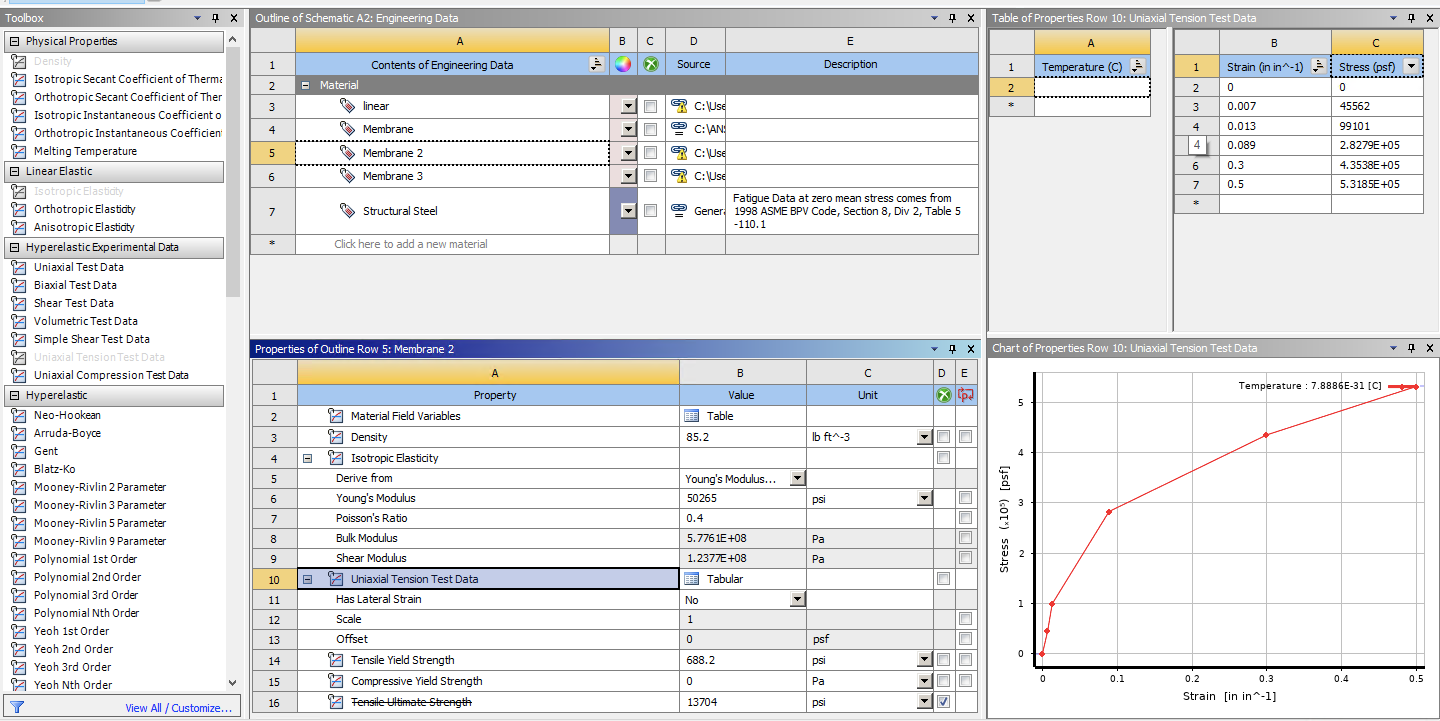
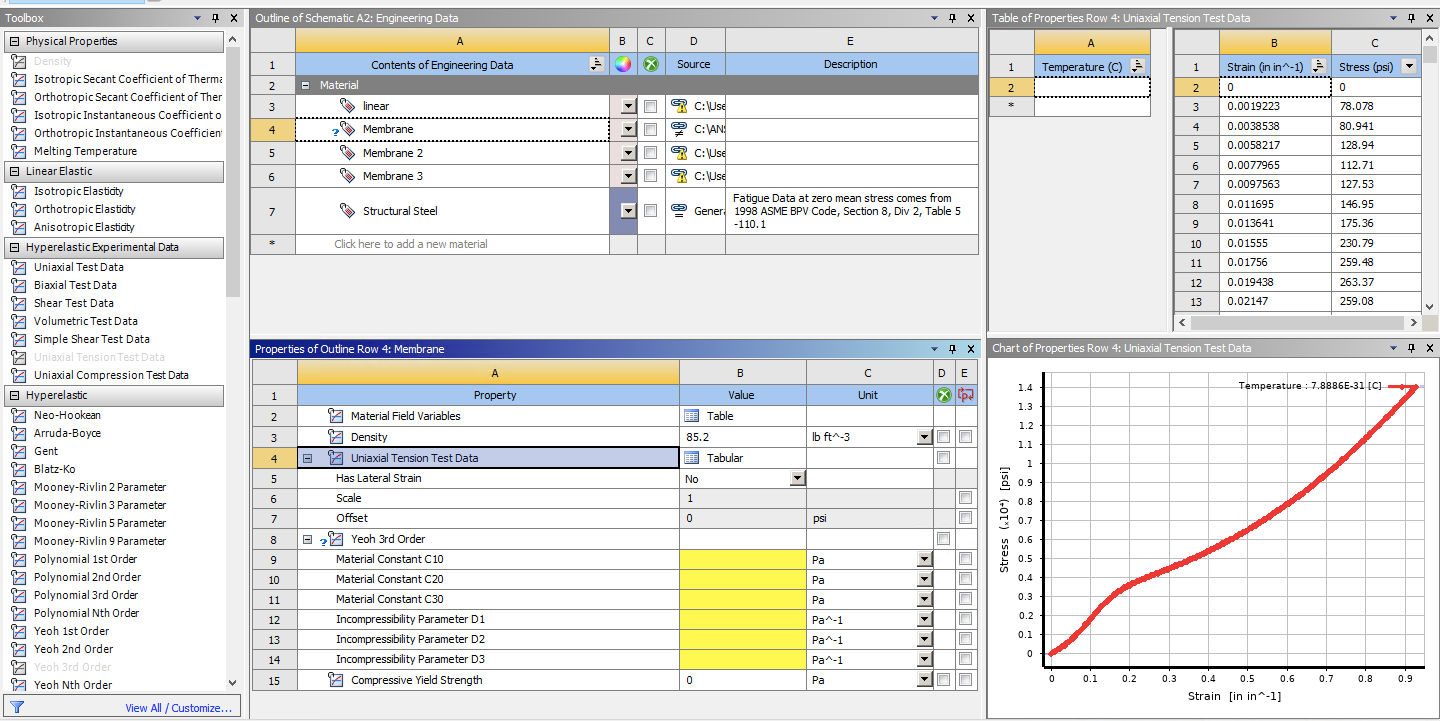
SubscriberHello, I am seeking help for the following problem. I need to run a nonlinear analysis in static structural. I have entered experimental data for a polyester PVC coated fabric in the uniaxial tension test data. ANSYS requires linear properties so I entered a modulus equal to the first section of my stress-strain curve. I believe I have setup nonlinear analysis correctly. I have large deflections on, multiple steps and substeps, and a ramped force, but I am not seeing the expected strains. I even changed the strain on the stress-strain curve and the results did not change. Why is my analysis not folowing the entered stress-strain curve?
-
August 25, 2023 at 5:14 pm
Armin
Ansys EmployeeHi Brian,
Could you elaborate more on how you defined the non-linear (plastic) behavior of your model? Did you employ the "Multilinear Isotropic Hardening" material model? How did you convert the experimental uniaxial tensile data into stress-strain curve for the model?
Also, could you add a plot on how the experimental force-displacement curve compares to that of the simulation?
-
August 25, 2023 at 6:15 pm
Brian Lolley
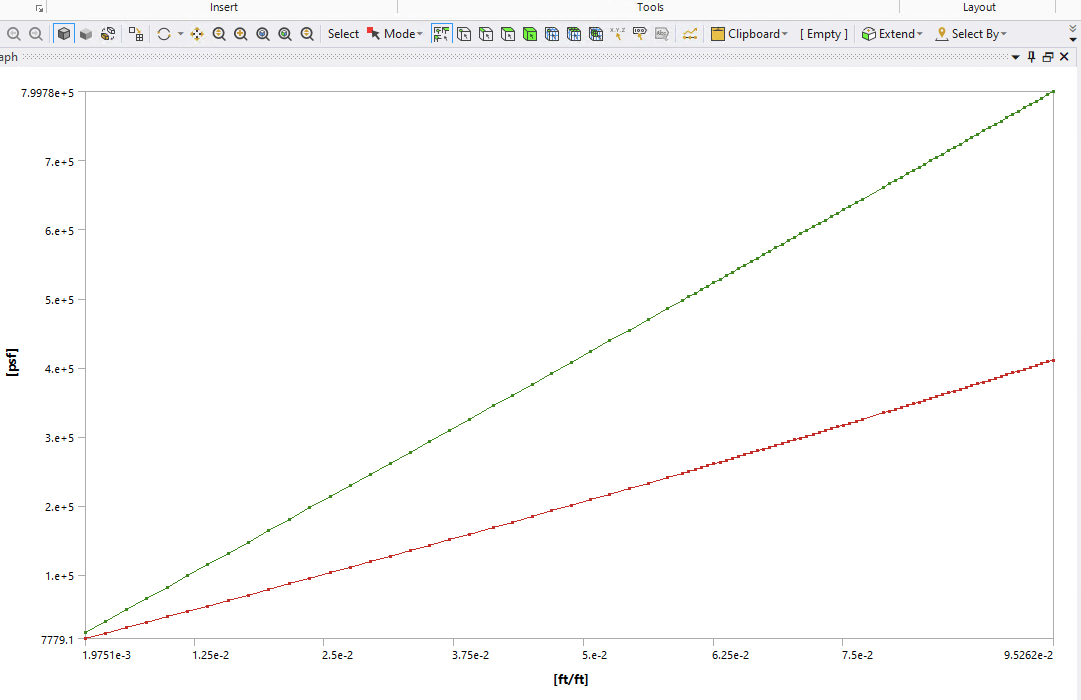
SubscriberSure. I have attached a photo of how I defined the model. I experimented using multilinear isotropic hardening but I was unable to get the model to run. I summarized the experimental data with just a few data points, but I increased the strain dramaticaly to make sure the solution was actually nonlinear and not just following the modulus. I am new to ANSYS so I do not know how to properly work the plots. I made the stress-strain curve and attached it, but I can only plot max and mins. The average stress of the solution was 456,440 psf and the average strain was 0.062 in/in.
-
August 25, 2023 at 7:47 pm
Armin
Ansys EmployeeThanks Brian.
I can see that you have selected Uniaxial Tensile Data under the "Hyperelastic Experimental Data". Is your goal to model your material as a hyperelastic material? If so, the video below may be helpful on how to use experimental data to calibrate hyperelastic material models.
How to Perform Curve-fitting for Hyperelastic Material Models — Lesson 1 - ANSYS Innovation Courses
-
August 25, 2023 at 9:34 pm
-
- The topic ‘Nonlinear Analysis with Uniaxial Test Data’ is closed to new replies.


-
3427
-
1057
-
1051
-
896
-
887

© 2025 Copyright ANSYS, Inc. All rights reserved.


