-
-
April 30, 2026 at 6:04 am
1819614500
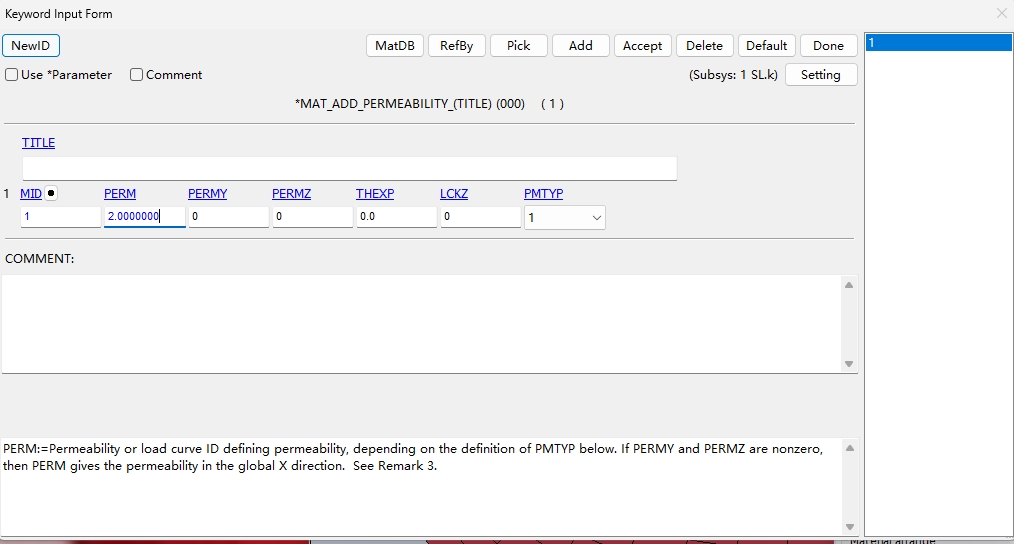
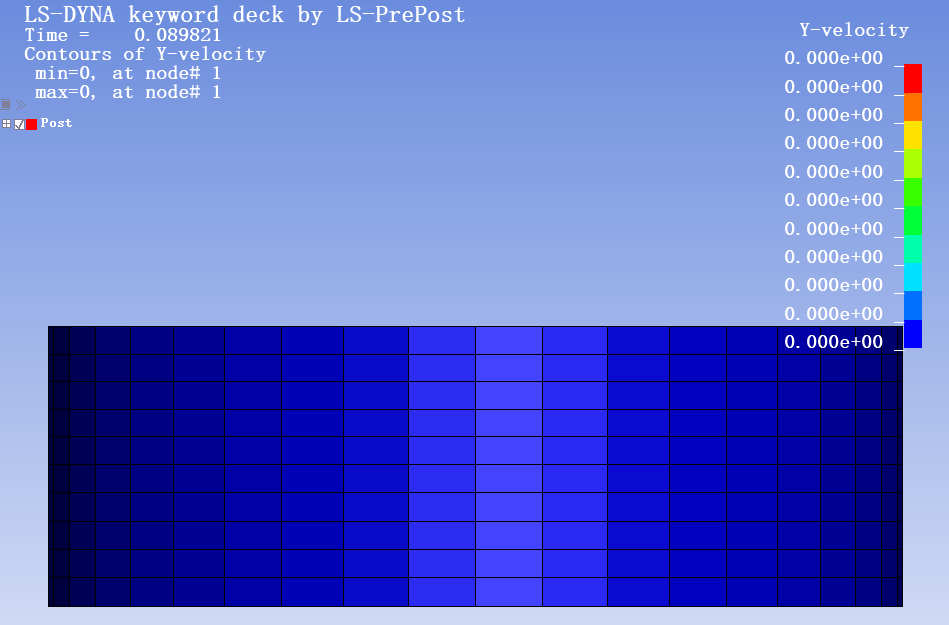
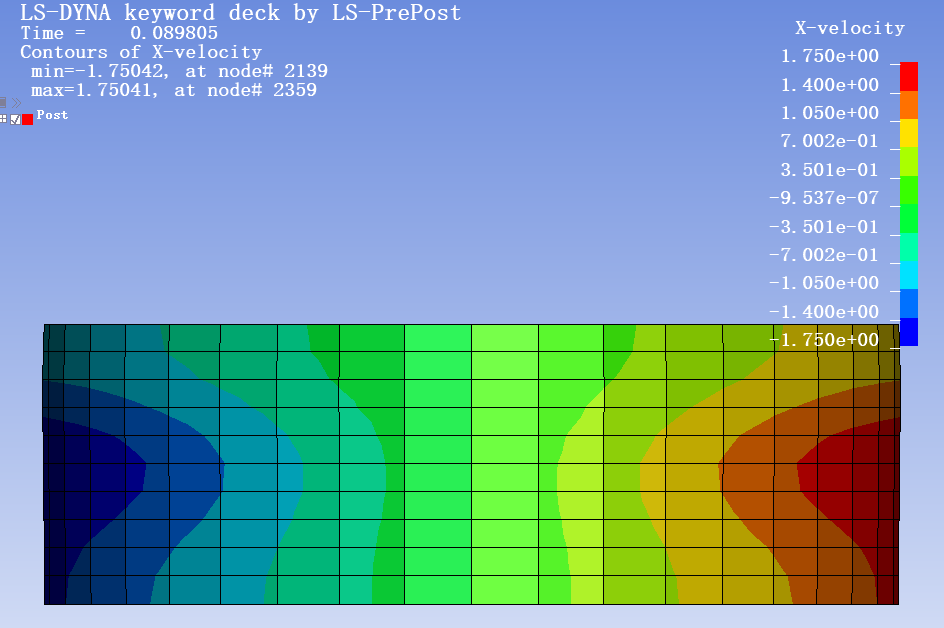
SubscriberHello, everyone. I am using MAT63 to model water seepage in porous media with the *MAT_ADD_PERMEABILITY keyword. According to the manual, this permeability model can incorporate a permeability vs. volume ratio curve. However, when I use a volume ratio dependent curve (PMTYP=1), the simulation yields no seepage velocity, and the pore pressure distribution does not obey Darcy's law. If I set a constant permeability (PMTYP=0), everything works fine.
Why might this happen? Is MAT63 not able to compute the volume ratio correctly, or am I misusing *ADD_PERMEABILITY?
Any insights or debugging advice would be greatly appreciated!


-
May 13, 2026 at 2:46 pm
Ram Gopisetti
SubscriberHi,Â
It seems you havent describe the usage of *CONTROL_PORE_FLUID for PERMEABILITY calculation and respect the element formulation 1,2,10,15.Â
It would be easy to debug if you follow the manual notes and I quote as follows
"variables requested on *DATABASE_EXTENT_BINARY. The first of the five is the pore pressure in stress units; the second is the excess pore pressure, meaning actual minus hydrostatic pressure. These follow the NEIPH extra variables requested by the user, so for example if NEIPH = 3 then there will be a total of 8 extra variables in the d3plot and d3thdt files of which the fourth is pore pressure. Even if NEIPH = 0, the d3plot and d3thdt files will still contain the five extra variables related to pore pressure. The same five extra variables are also written to the elout file, but only if OPTION1 > 0 on *DATABASE_ ELOUT.Further optional output to d3plot, d3thdt, and nodout files is available for nodal pore pressure variables; see *DATABASE_PWP_OUTPUT.
For time-dependent and steady-state consolidation, information on the progress of the analysis is written to d3hsp file."ÂCheers, Ram
-
May 15, 2026 at 5:54 am
1819614500
SubscriberHi Ram,
Thank you for your reply. Your suggestions have been very helpful for my learning. The parts you mentioned should be properly set up, and I am able to view the pore pressure through the extra variables.
However, I encountered an issue when trying to use a variable permeability (e.g., PMTYP = 1, 2, 3). In this case, the pore pressure and seepage velocity becomes much lower than when using a constant permeability (almost three orders of magnitude)— even when the permeability curve keeps the value constant. Apart from changing the permeability type, all other keywords remain exactly the same.
I wonder if you have any insights into this phenomenon.
Regardless, thank you again for your reply.

-
-
- You must be logged in to reply to this topic.
-
6420
-
1906
-
1457
-
1308
-
1022
© 2026 Copyright ANSYS, Inc. All rights reserved.