TAGGED: far-field, farfield, projection
-
-
July 31, 2024 at 8:21 pm
Joohyung Song
SubscriberHi all,
I have a problem with simulating parabolic reflectors(PR) with two dipole sources around the focus. In the PR, I am looking at the light collection efficiency using the far-field projection analysis(https://optics.ansys.com/hc/en-us/articles/360034395194-Changing-the-far-field-refractive-index-analysis-object).
I put two dipole sources with out-of-phase (pi difference phases), and the result is the negative value of the intensity spectrum of the far field(="T far 2" in the far-field projection analysis) which shouldn't be a negative value! I believe there are some problems with the farfield3d calculation but I am not sure where this error comes from. Does anyone let me know what the problem is?
-
July 31, 2024 at 10:30 pm
Guilin Sun
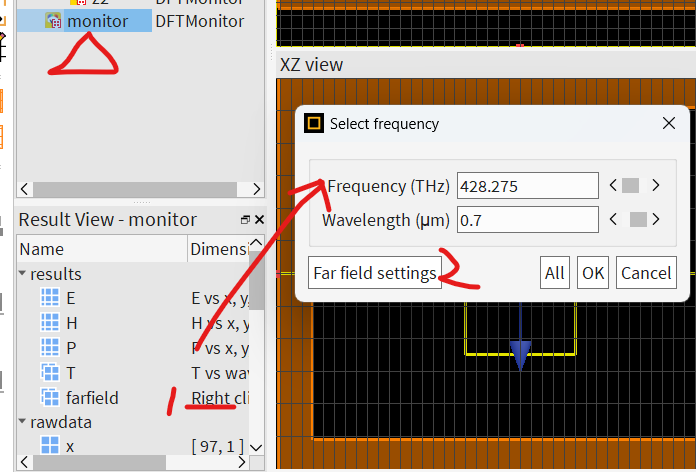
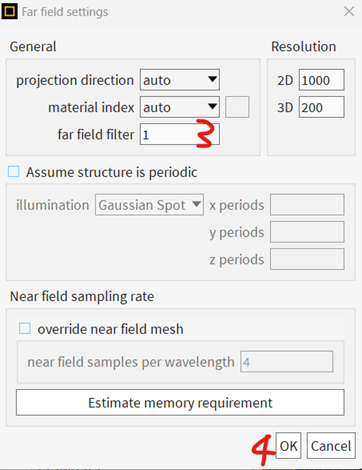
Ansys EmployeeFrom your description, it might be due to the fields at the monitor edge are clipped. Please first check monitor data with visualizer. and then using the farfield in the visualizer do the farfield projection. Please turn on the farfield filter :
If the fields are clipped you will need to increase the simulation area and the monitor size, and test again.
If not, please send some screenshot of the simulation settings and the results so I can understand better.
Make sure the simulation is long enough and it reaches the autoshutoff min before it is terminated.
-
August 5, 2024 at 5:17 pm
Joohyung Song
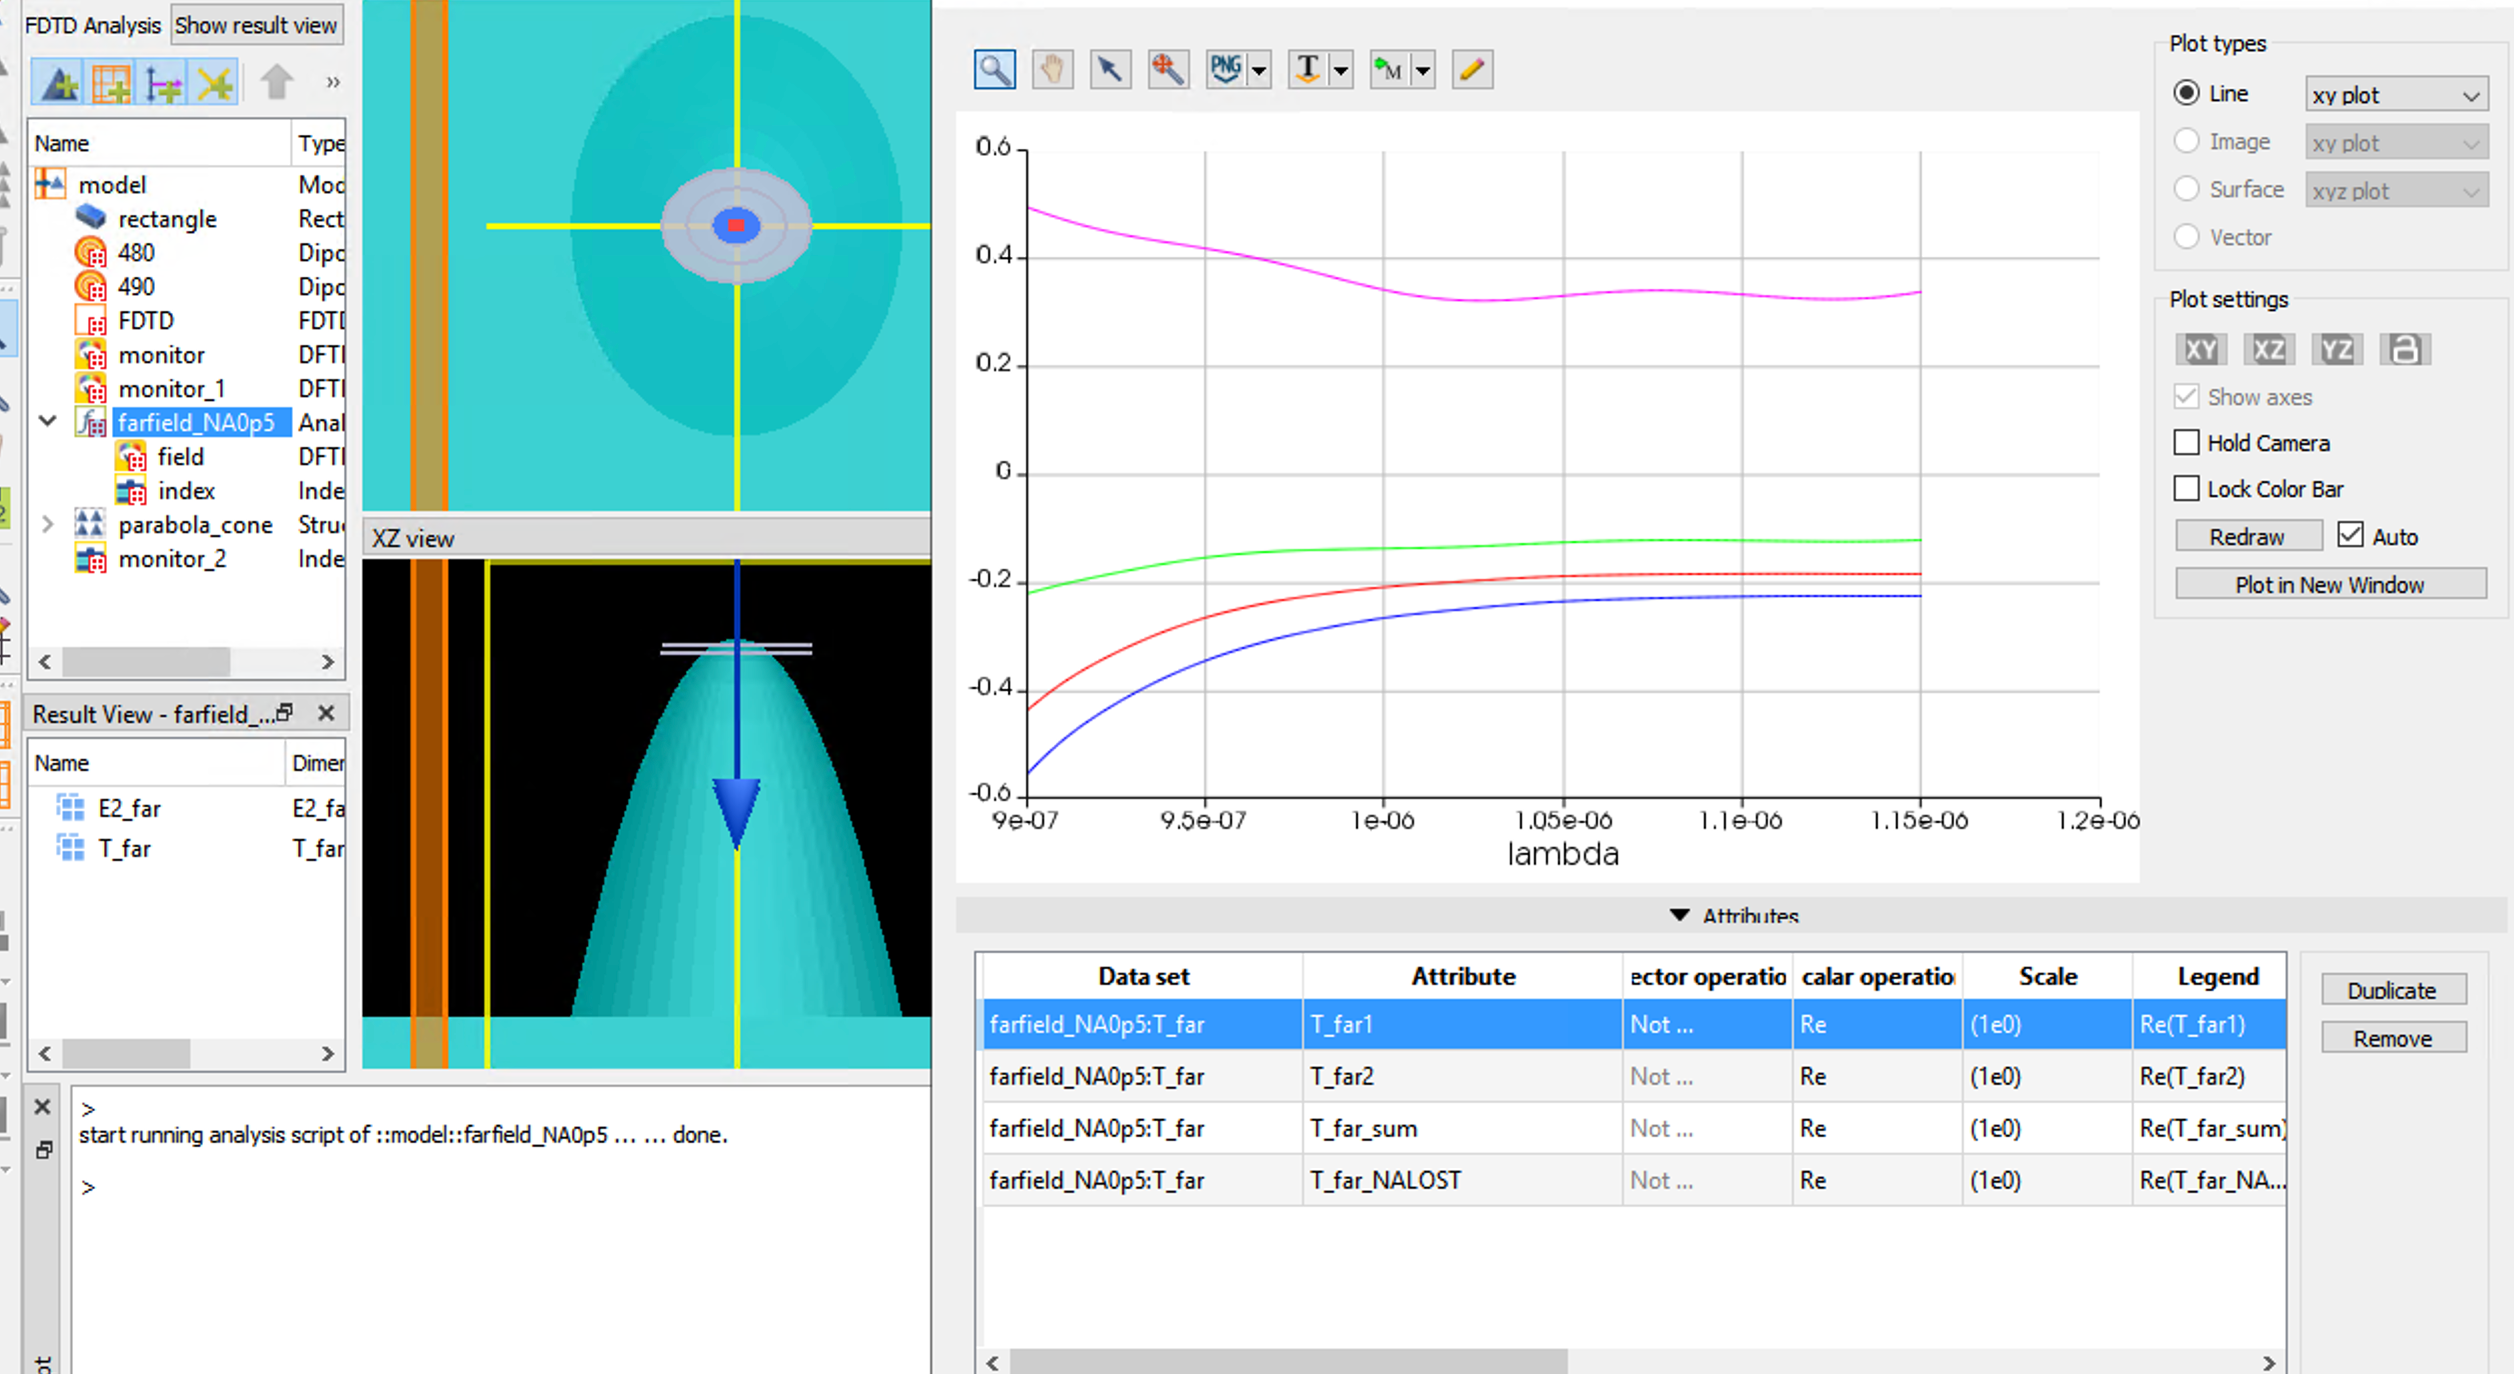
SubscriberHi, I turned on the filter but the problem is still there. You can see the figures below. I have two out-of-phase dipole sources and the source wavelength is 900~1100nm. The chosen monitor(right figure of structure) is 1um away from the bottom of the parabolic structure. It shouldn't be just T_far2, but T_far1 shouldn't be negative. Can you check the problem again?
-
August 5, 2024 at 5:18 pm
Joohyung Song
SubscriberIn addition to it, the simulation was long enough to auto shutoff.
-
August 15, 2024 at 3:10 pm
Guilin Sun
Ansys EmployeeMy previous reply was not shown properly.
Since I do not know your analysis script, I can only say that, if you are using Poynting vector to calculate the transmission, it is normal to have "negative" transmission:
It integrates the poynting vector dot the monitor surface norm. The monitor surface norm is always toward the positive axis. When the light propagates along the negative axis, the dot result is negative.
You can simply filp the sign. In visualizer, you can use "-Re".
If you use intensity integration, it should be positive since intensity is always positive.
Please check your script.
-
- The topic ‘Negative value of intensity spectrum with the far field project analysis’ is closed to new replies.


-
3492
-
1057
-
1051
-
955
-
932

© 2025 Copyright ANSYS, Inc. All rights reserved.


