-
-
May 6, 2024 at 5:37 pm
Jake Woods
SubscriberHi all,
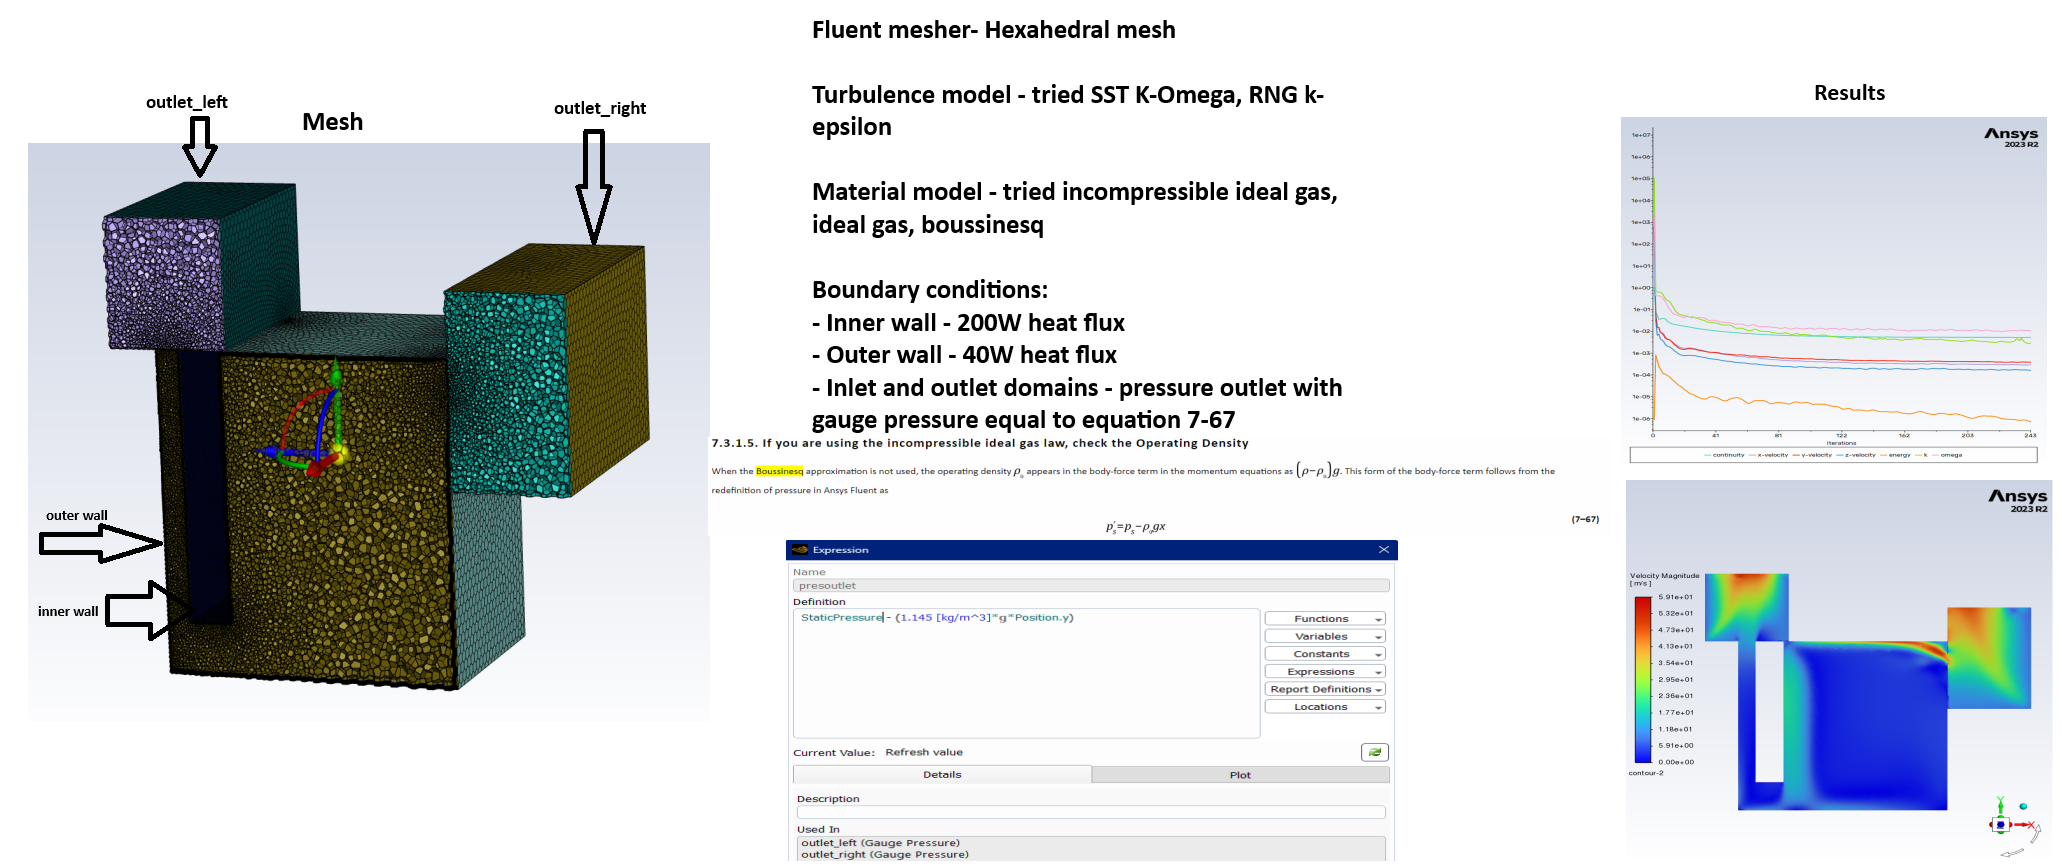
I am having issues with my Fluent simulation, in which I am modelling a solar chimney.
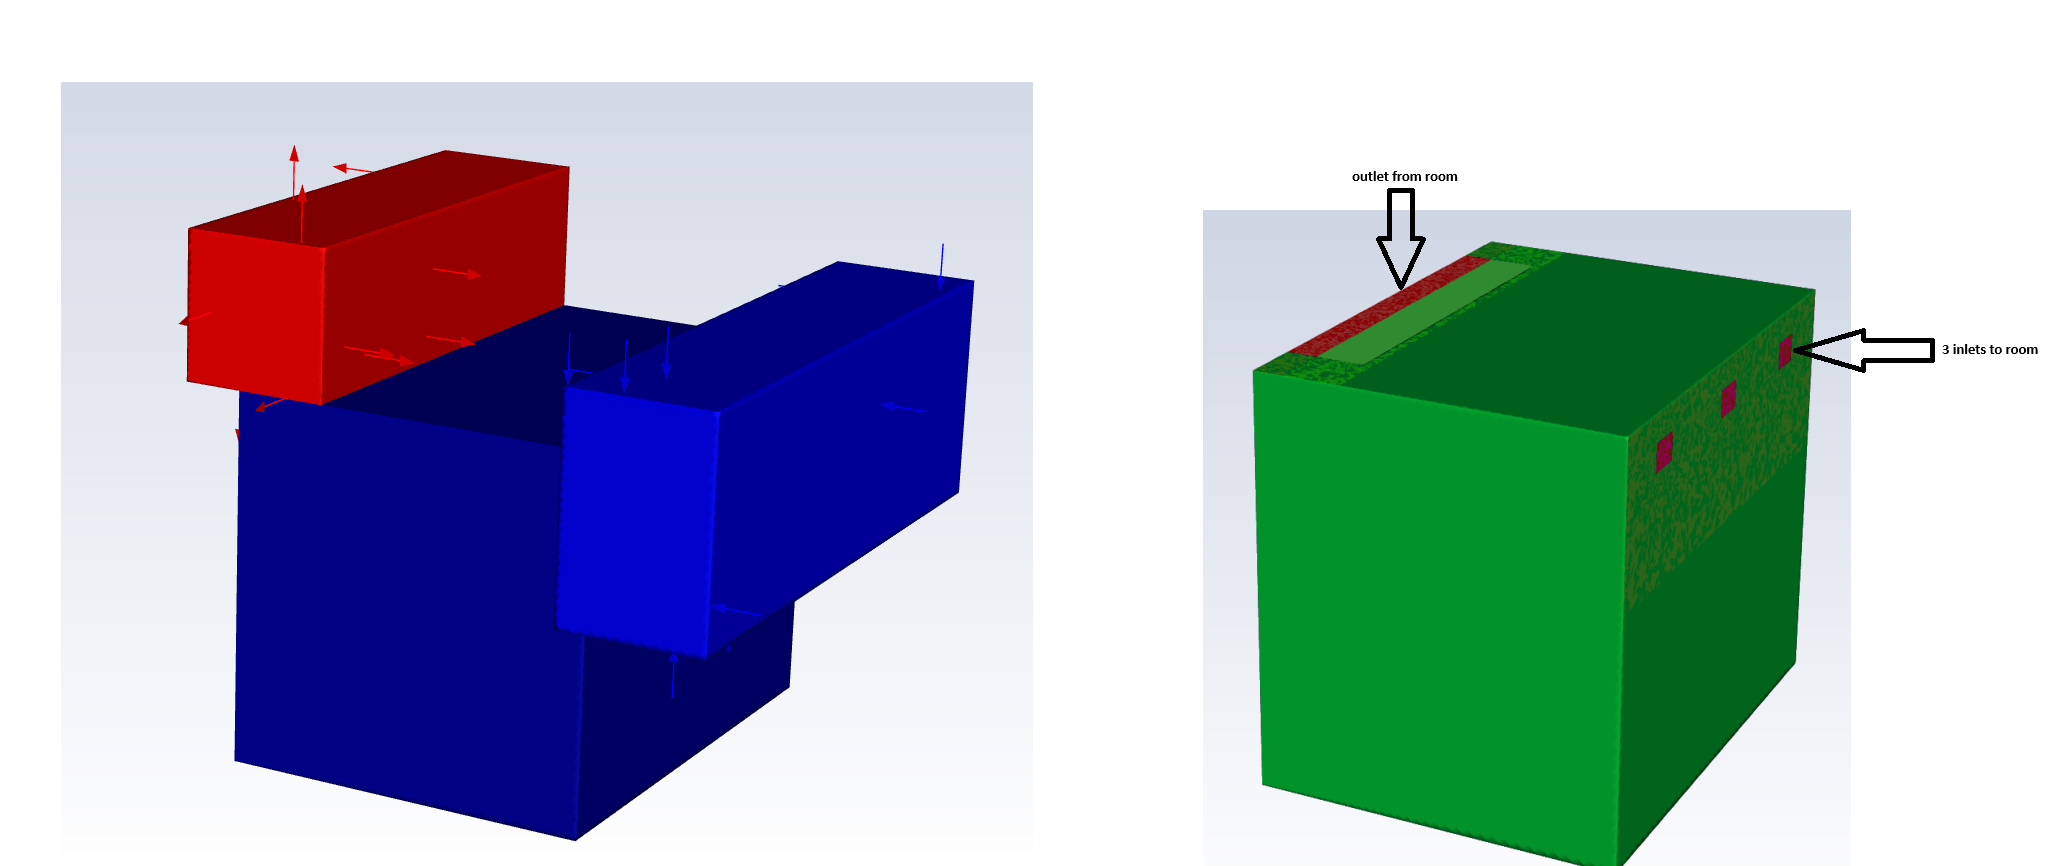
I am aiming to obtain the steady state value for the mass flow rate at the outlet. The illustration below pictures my simulation setup. I have 3 domains, the outlet_right, indoor, and outlet_left. The outlets are set up to be at ambient conditions. I have set two outlets in order to be able to set the gauge pressure at both instead of the total gauge pressure at the inlet. I am currently experimenting with 3 small holes as inlets to the room, but I have also tried with one bigger one and obtained similar results.
I am expecting buoyant flow due to the heat flux applied on the walls. Unfortunately, the residuals remain high and the mass flow rate reaches 5kg/s (around 100 times higher than expected). As also visible in the contour, velocities reach 59m/s which are unrealistic and high.
I think that the issue might lie within the boundary conditions. However, I have set them according to the Ansys Fluent guide (pictured in screenshot).
Could anyone kindly take a look at this and advise me on what might be going wrong?
Thank you.
-
May 7, 2024 at 10:21 am
Rob
Forum ModeratorAssuming the mesh quality is good, and with inflation over the holes it may not be (look up aspect ratio) then you need to have a look at operating density & boundary conditions.
For incompressible ideal gas set the operating density to be equal to the outside condition: initialise from the boundary and let Fluent calculate the density. Set that exact value, to all decimal places, in the Operating Conditions panel. You're aiming to remove the density term in equation 7-68 https://ansyshelp.ansys.com/account/Secured?returnurl=/Views/Secured/corp/v241/en/flu_ug/flu_ug_bcs_sec_operating.html%23flu_ug_sec_hxfer_buoy
You may also want to patch in an updwards velocity in the chimney to assist the solver.
-
May 7, 2024 at 1:06 pm
Jake Woods
SubscriberHi Rob, thank you for your prompt reply.
I will try out your recommendations shortly. I just had a couple of queries please:
When you say 'initialise from the boundary', do you mean to globally initialise with the conditions at the boundary (atmospheric)? And then take the average density globally which Fluent calculates?
-
May 7, 2024 at 1:50 pm
Rob
Forum ModeratorYes, you should get a single density for the domain (in contours turn off node values) as opposed to an average. You can patch regions with velocity/temperature/whatever later on, this step is just to get the operating density.
-
May 7, 2024 at 7:34 pm
Jake Woods
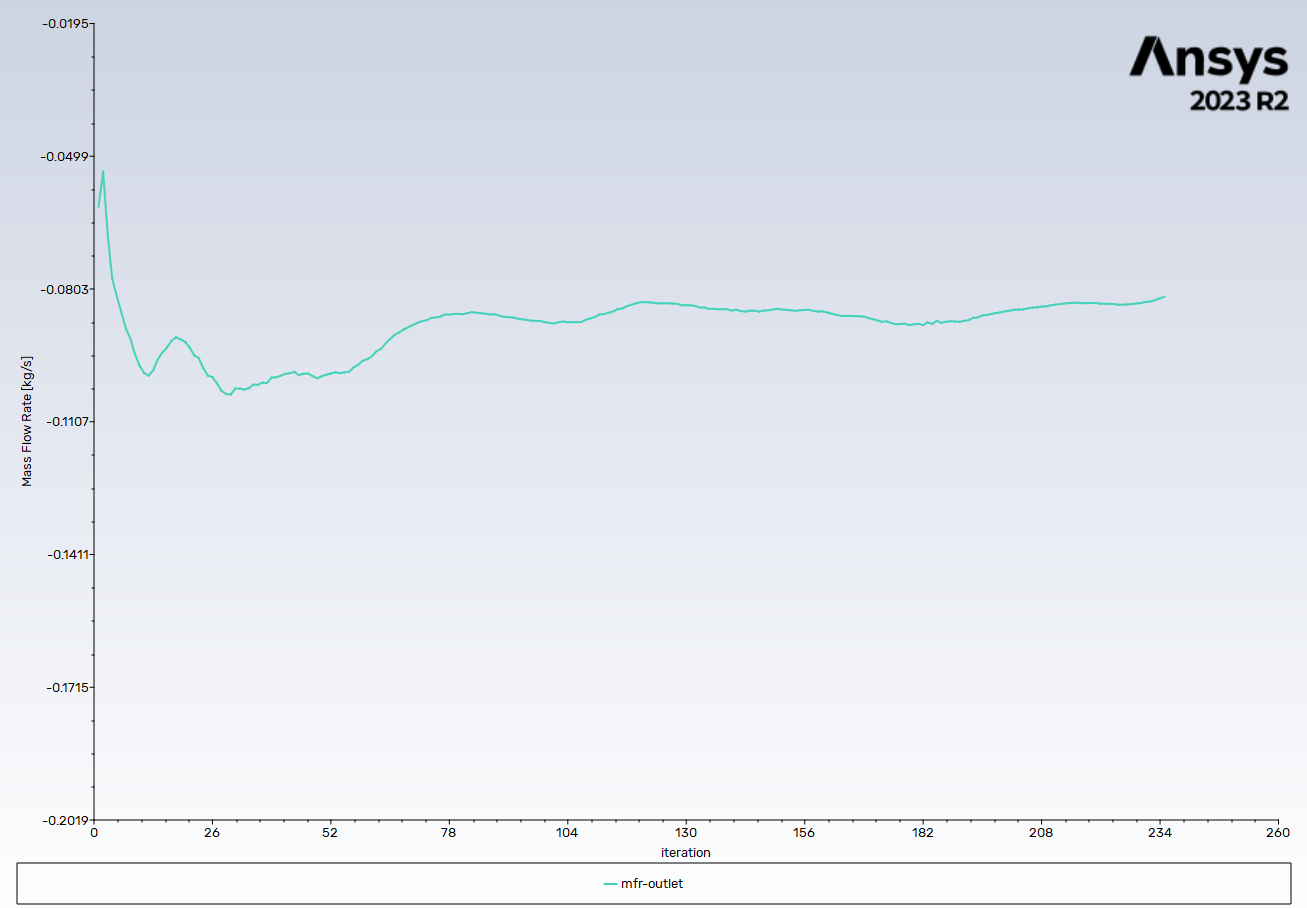
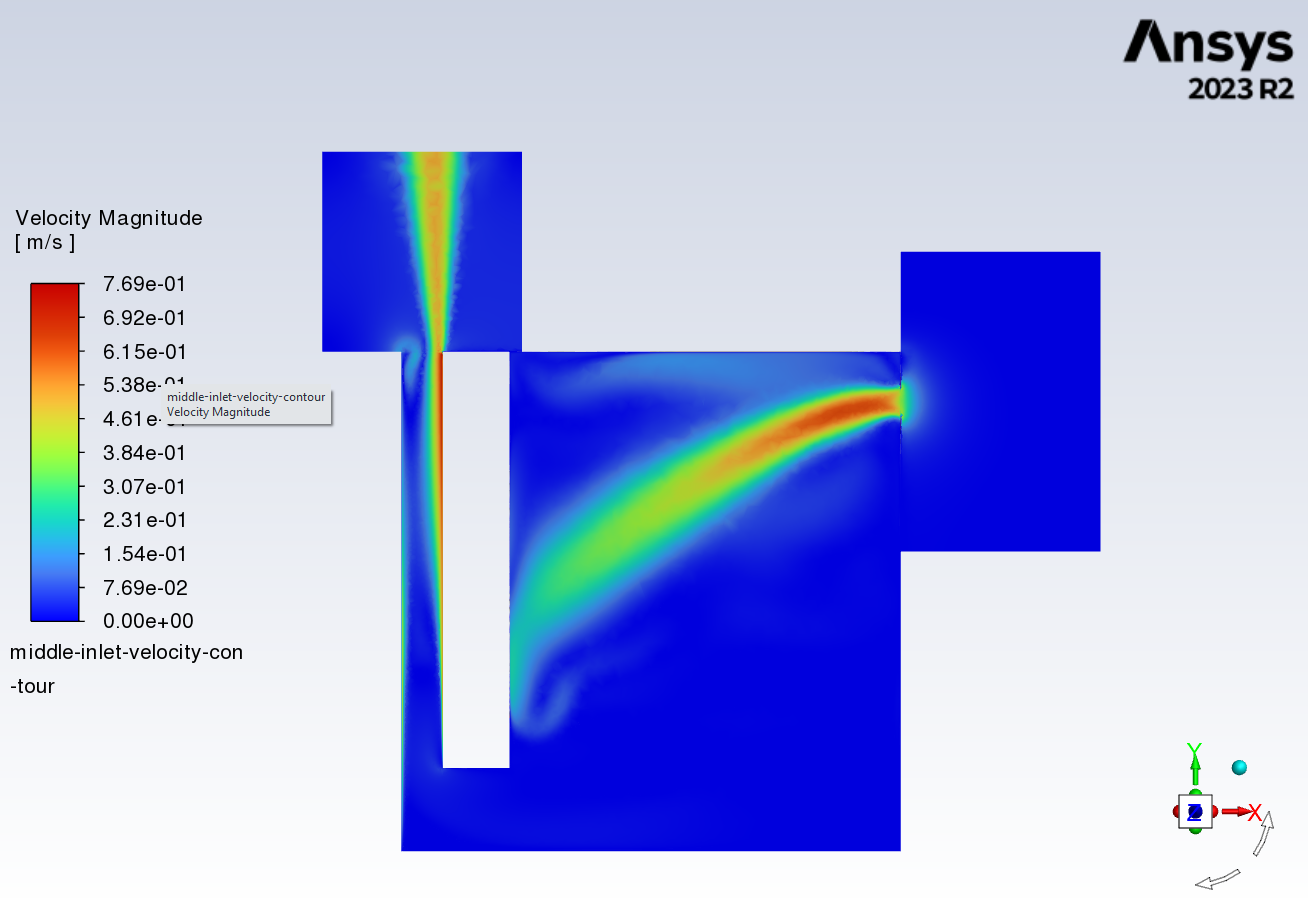
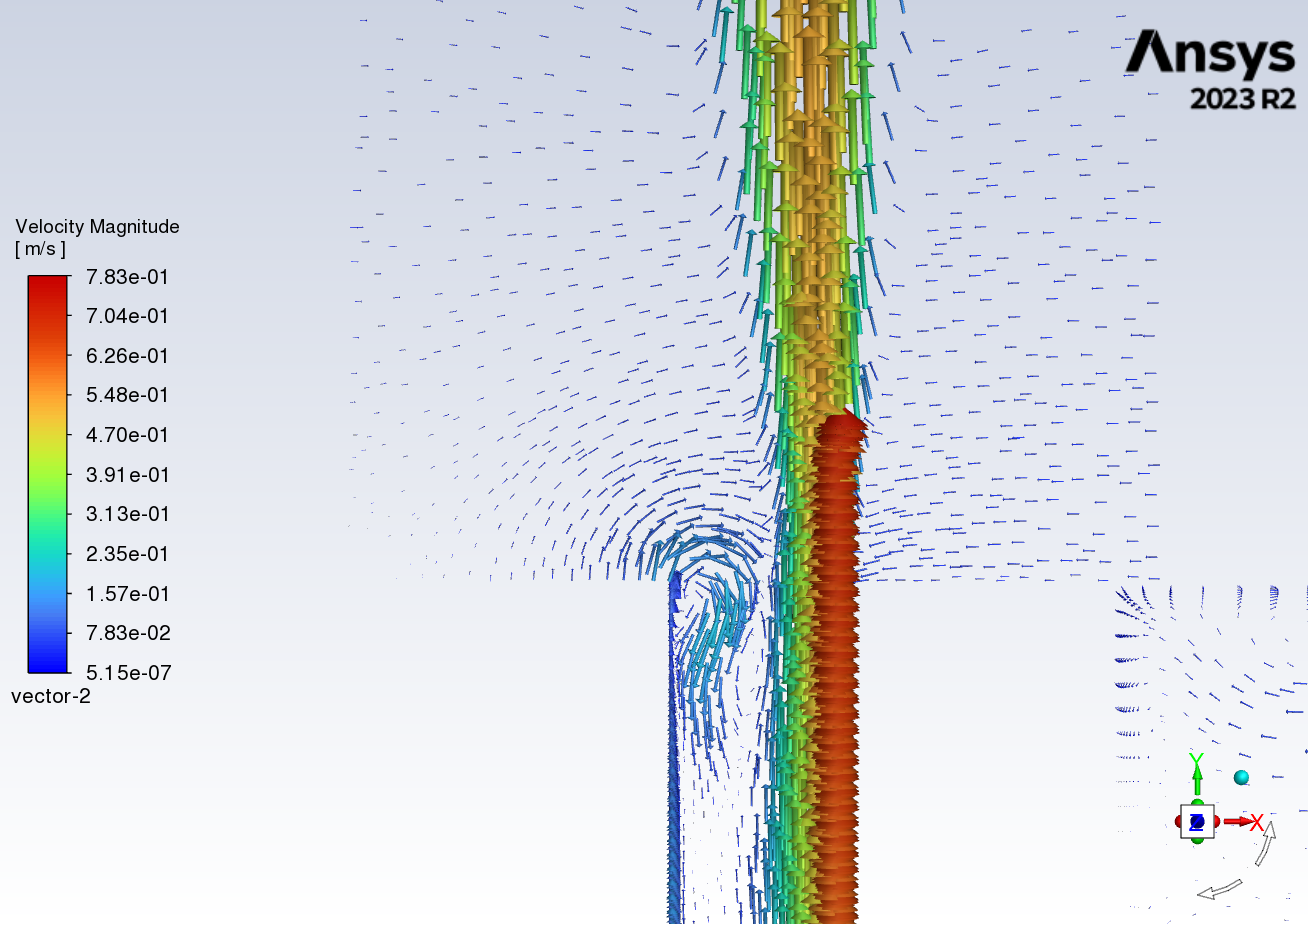
SubscriberI have followed your steps (including patching), and got the following results. I also set the gauge pressure at both pressure outlets to 0 Pa as per point 3 - /courses/wp-content/uploads/sites/2/2024/01/2041750.pdf. Mass flow rate exiting the chimney seems to have converged within around 5%, and the values are realistic. Contours and vector plots are much better and closer to expectation. However, residuals remain high. There is some reverse flow as pictured, could this potentially be causing convergence issues?

-
May 8, 2024 at 10:22 am
Rob
Forum ModeratorWelcome to HVAC modelling.... Plot the above vector and contour plots every 5-10 iterations for 100 or so iterations. What you're seeing is a number of transient features in the flow field. You also need to run a lot more iterations to get the residuals to properly flatline; 1000 or so is a good starting point, only tutorials work within 150 iterations!
-
May 13, 2024 at 6:45 pm
Jake Woods
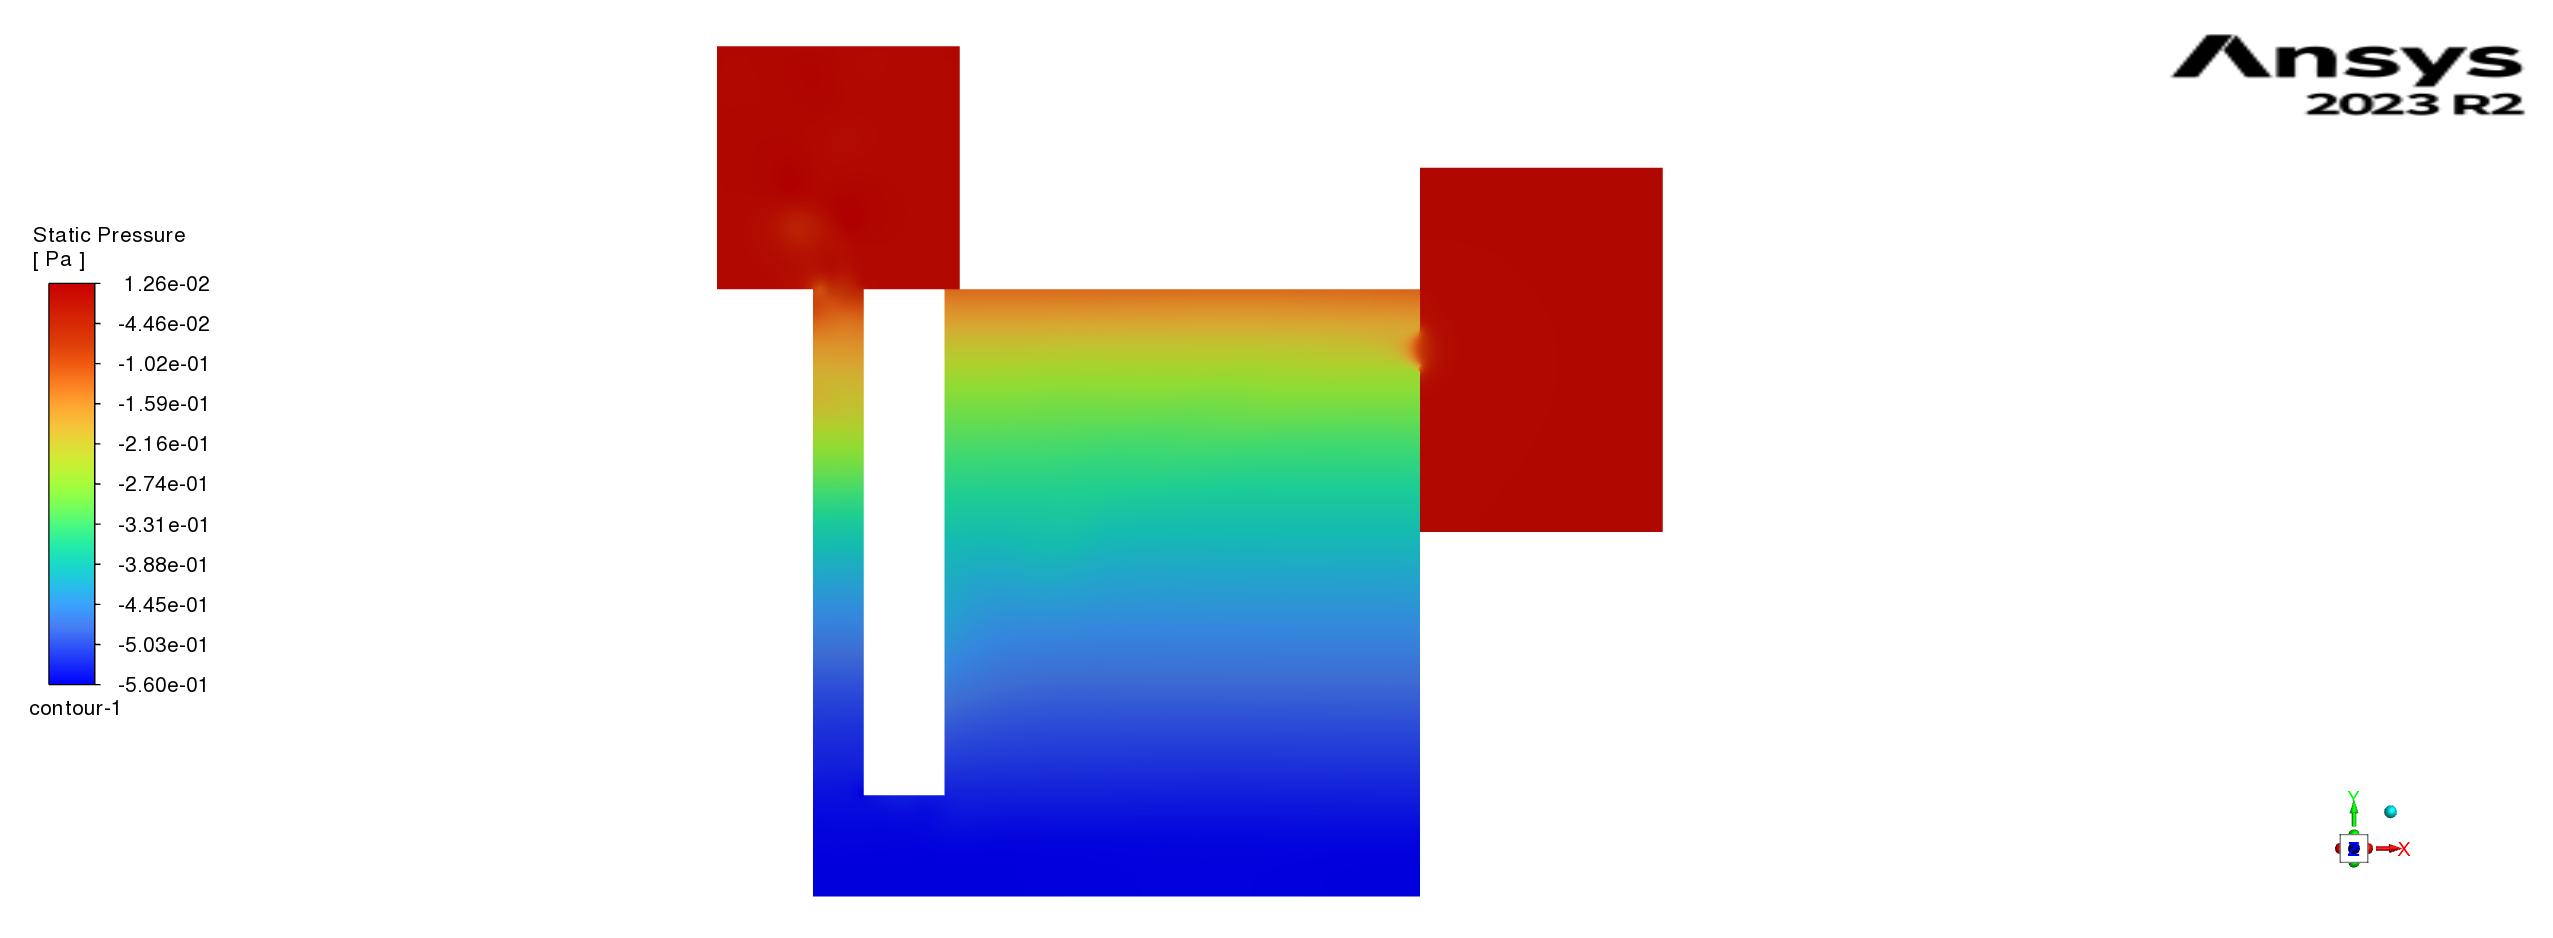
SubscriberHi Rob, I have managed thanks to your help to get a converged solution. I have a question please regarding the following pressure plot, is the pressure displayed here p's or ps? As I would expect the static pressure in the plot to be different, high pressure at the bottom and lower pressure at the top. But it seems that it is opposite in the plot, as the pressure is highest at the top which would make sense if it's ps as through equation 7-68, p's= p' + pgh.
-
- The topic ‘Natural convection convergence issues’ is closed to new replies.


-
3492
-
1057
-
1051
-
965
-
942

© 2025 Copyright ANSYS, Inc. All rights reserved.

