TAGGED: ansys-hfss, hfss, plot-results, rectangular
-
-
June 29, 2023 at 10:11 pm
hyhaerong
SubscriberÂ
Hello! I have created a plot of the jsurf induced at the port using HFSS. What I would like to do is visualize the differences in the jsurf at the port based on variations in a parameter through a rectangular plot. Is it possible?
I would like to create two graphs on the plot: one for the average value of the jsurf induced at the port and another for the maximum value. The x-axis should represent the parameter, while the y-axis should represent the jsurf values.
Is there a way to do this?
-
July 2, 2023 at 2:43 am
Faezeh Ladani
Ansys EmployeeHi Hyhaerong,
Yes, you can do these kind of operations using fields calculator.
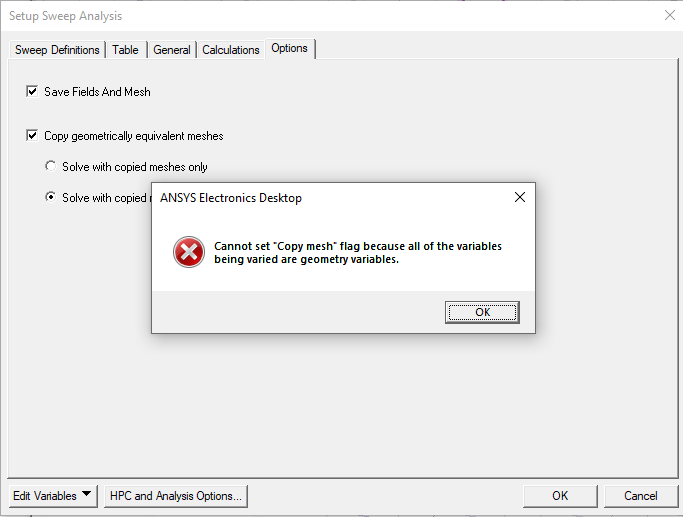
First, make sure you select Save Fields and Mesh in your parametric setup (in the last Tab>Options) before you run the simulation.Â
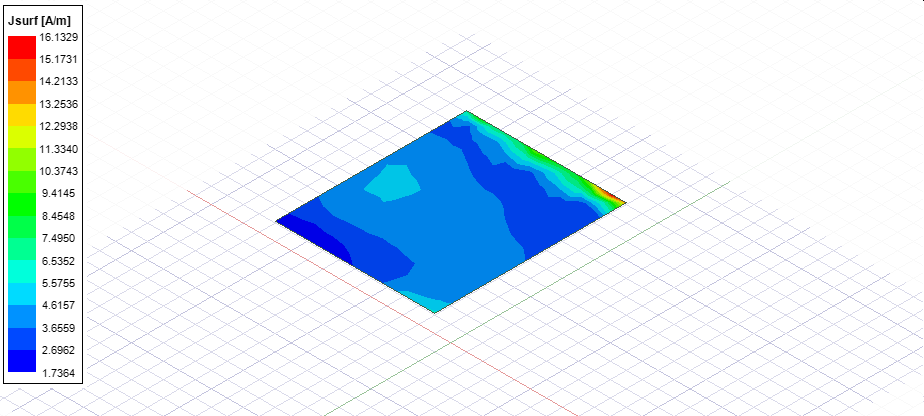
Then you can use fields calculator to create your desired field expressions (e.g. Average over a certain surface). You will add these expressions with a name and then you can plot. There is extensive information on the online help for how to access and use fields calculator. You can find it in the Post Processing and Generating Reports (23-411).
After you created these fields expressions, you can simply right click on the results, Create Fields Report, select Rectangular Plot and then select Calculator Expressions in category. You can find these field expressions listed among other default expressions. Also, you can change the default Primary Sweep to your parameter.Â
Â
Â
Â
-
July 3, 2023 at 2:12 am
hyhaerong
Subscriber
-
- The topic ‘Make rectangular plot from the field plot’ is closed to new replies.
- Ansys Maxwell 3D – eddy current
- Difficulty/Obstacle: “Parasolid entry check failed for part:”
- Maxwell circuit – PWM
- Plotting Ex, Ey and Ez in vector forms individually
- Simplorer+Maxwell Cosimulation results and Maxwell results mismatch
- Ansys-MATLAB Co-Simulation
- Y wiring method and the start and end points of winding.
- Compute near field simulation with current
- Ansys HFSS, Lumped port impedance affects Z-parameters
- Calculating E-field tangential to a 2D resonant structure on a sapphire chip
-
2122
-
918
-
599
-
591
-
483
© 2025 Copyright ANSYS, Inc. All rights reserved.