-
-
July 13, 2024 at 2:58 am
CHEON HYEJUN
Subscriberhello. This is my first time using lumerical fdtd.
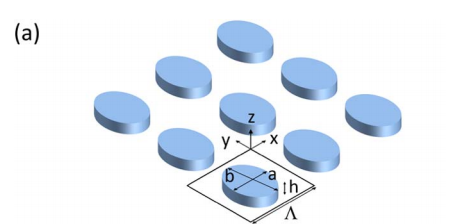
In the process of verifying the topic 'Wave manipulation with designer dielectric metasurfaces', I have a question about whether such a function exists.

There is a graph that obtains the phase and transmission amplitude by adjusting the size of the disk (variables a and b) in the photo below. To obtain such a graph, if there is an automatic repeat function in the program, you must change each size yourself. I am asking because I am curious as to whether I need to obtain each data and draw the corresponding graph through Python or Matlab. -
July 15, 2024 at 5:01 pm
Guilin Sun
Ansys EmployeeSince you have a similar post in Korean, please wait for reply there and this post will be closed.
-
Viewing 1 reply thread
- The topic ‘lumerical fdtd function question’ is closed to new replies.
Ansys Innovation Space


Trending discussions


Top Contributors


-
3462
-
1057
-
1051
-
918
-
896
Top Rated Tags


© 2025 Copyright ANSYS, Inc. All rights reserved.
Ansys does not support the usage of unauthorized Ansys software. Please visit www.ansys.com to obtain an official distribution.


