TAGGED: excel, liquid-fraction, report-plots, xyplot
-
-
May 20, 2024 at 10:07 pm
Philip Lim
SubscriberHi,
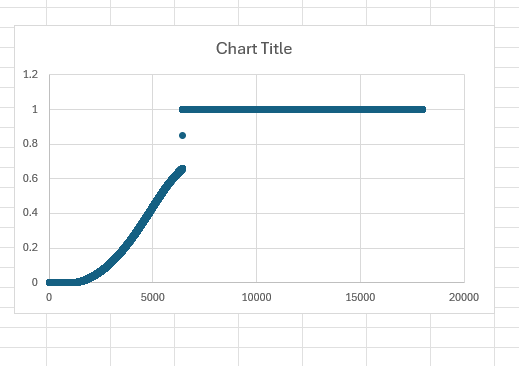
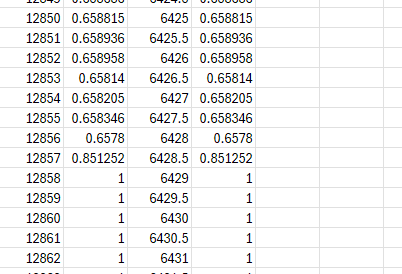
I plotted a liquid fraction vs time graph in excel for mesh convergence shown below, then I realised data set was not normal. However, when I was running a model with a finer mesh size, I have got a continuous data.Â
Why did this happen? is it because of the mesh condition?
Â
Thank you for the help in advance :)
-
May 21, 2024 at 8:37 am
SRP
Ansys EmployeeHi,
Yes right, a finer mesh likely captured the variations in the liquid fraction more accurately, resulting in smoother and more continuous data over time.
Thank you.
-
Viewing 1 reply thread
- The topic ‘Liquid fraction seems weird’ is closed to new replies.
Ansys Innovation Space
Trending discussions
- How do I get my hands on Ansys Rocky DEM
- Non-Intersected faces found for matching interface periodic-walls
- Unburnt Hydrocarbons contour in ANSYS FORTE for sector mesh
- Help: About the expression of turbulent viscosity in Realizable k-e model
- Script Error
- Facing trouble regarding setting up boundary conditions for SOEC Modeling
- convergence issue for transonic flow
- Running ANSYS Fluent on a HPC Cluster
- Point exception in erosion calculation
- Errors with multi-connected bodies using AQWA
Top Contributors
-
1942
-
865
-
599
-
591
-
366
Top Rated Tags
© 2025 Copyright ANSYS, Inc. All rights reserved.
Ansys does not support the usage of unauthorized Ansys software. Please visit www.ansys.com to obtain an official distribution.