-
-
October 2, 2024 at 2:00 pm
uiluj
SubscriberDear cmmunity,
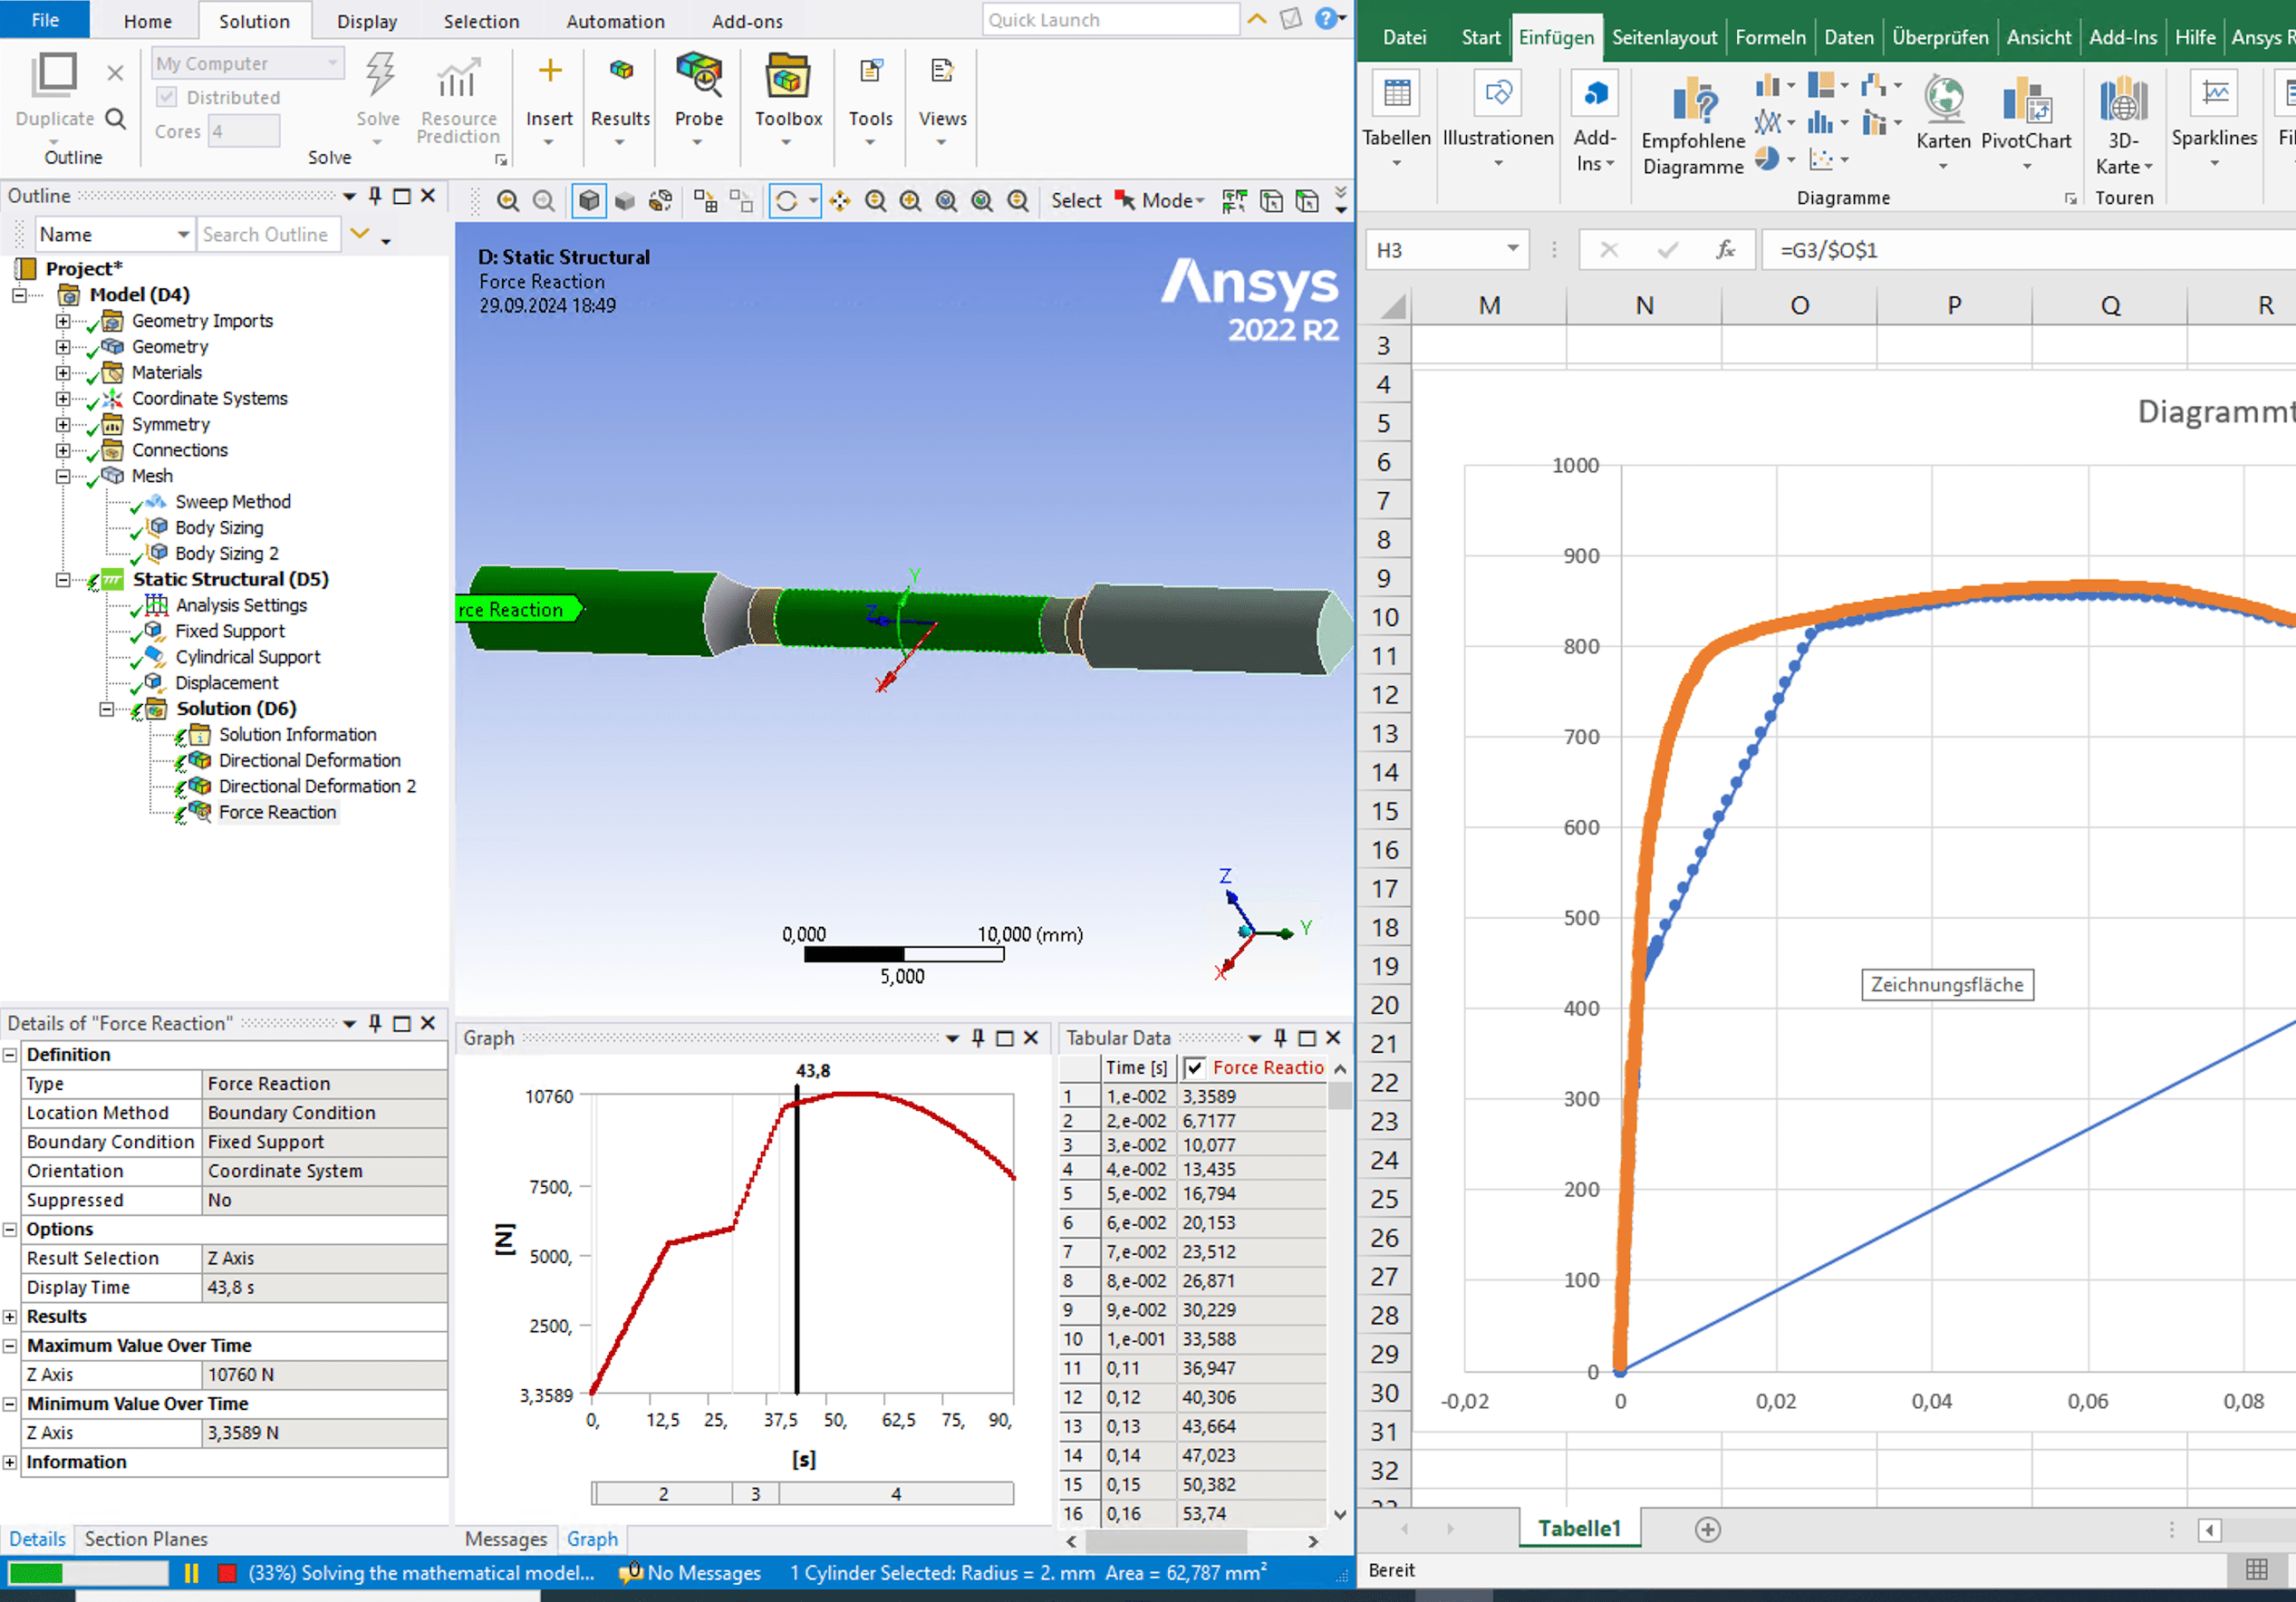
im trying to reacreate a tensile test in ansys to validate a voce-swift-hardening model. The result of the real life tensile test is plotted in the excel sheet as the oragne curve and the ansys result is plotted as the blue curve.
As you can see, there is a part of the strain stress curve that is constant in the ansys result. I need some help in finding the reason for this. I used the static structural component for this with mulitlinear kinematic hardening.
kind regards,
Sebastian
-
October 2, 2024 at 2:54 pm
Armin
Ansys EmployeeHi Sebastian,
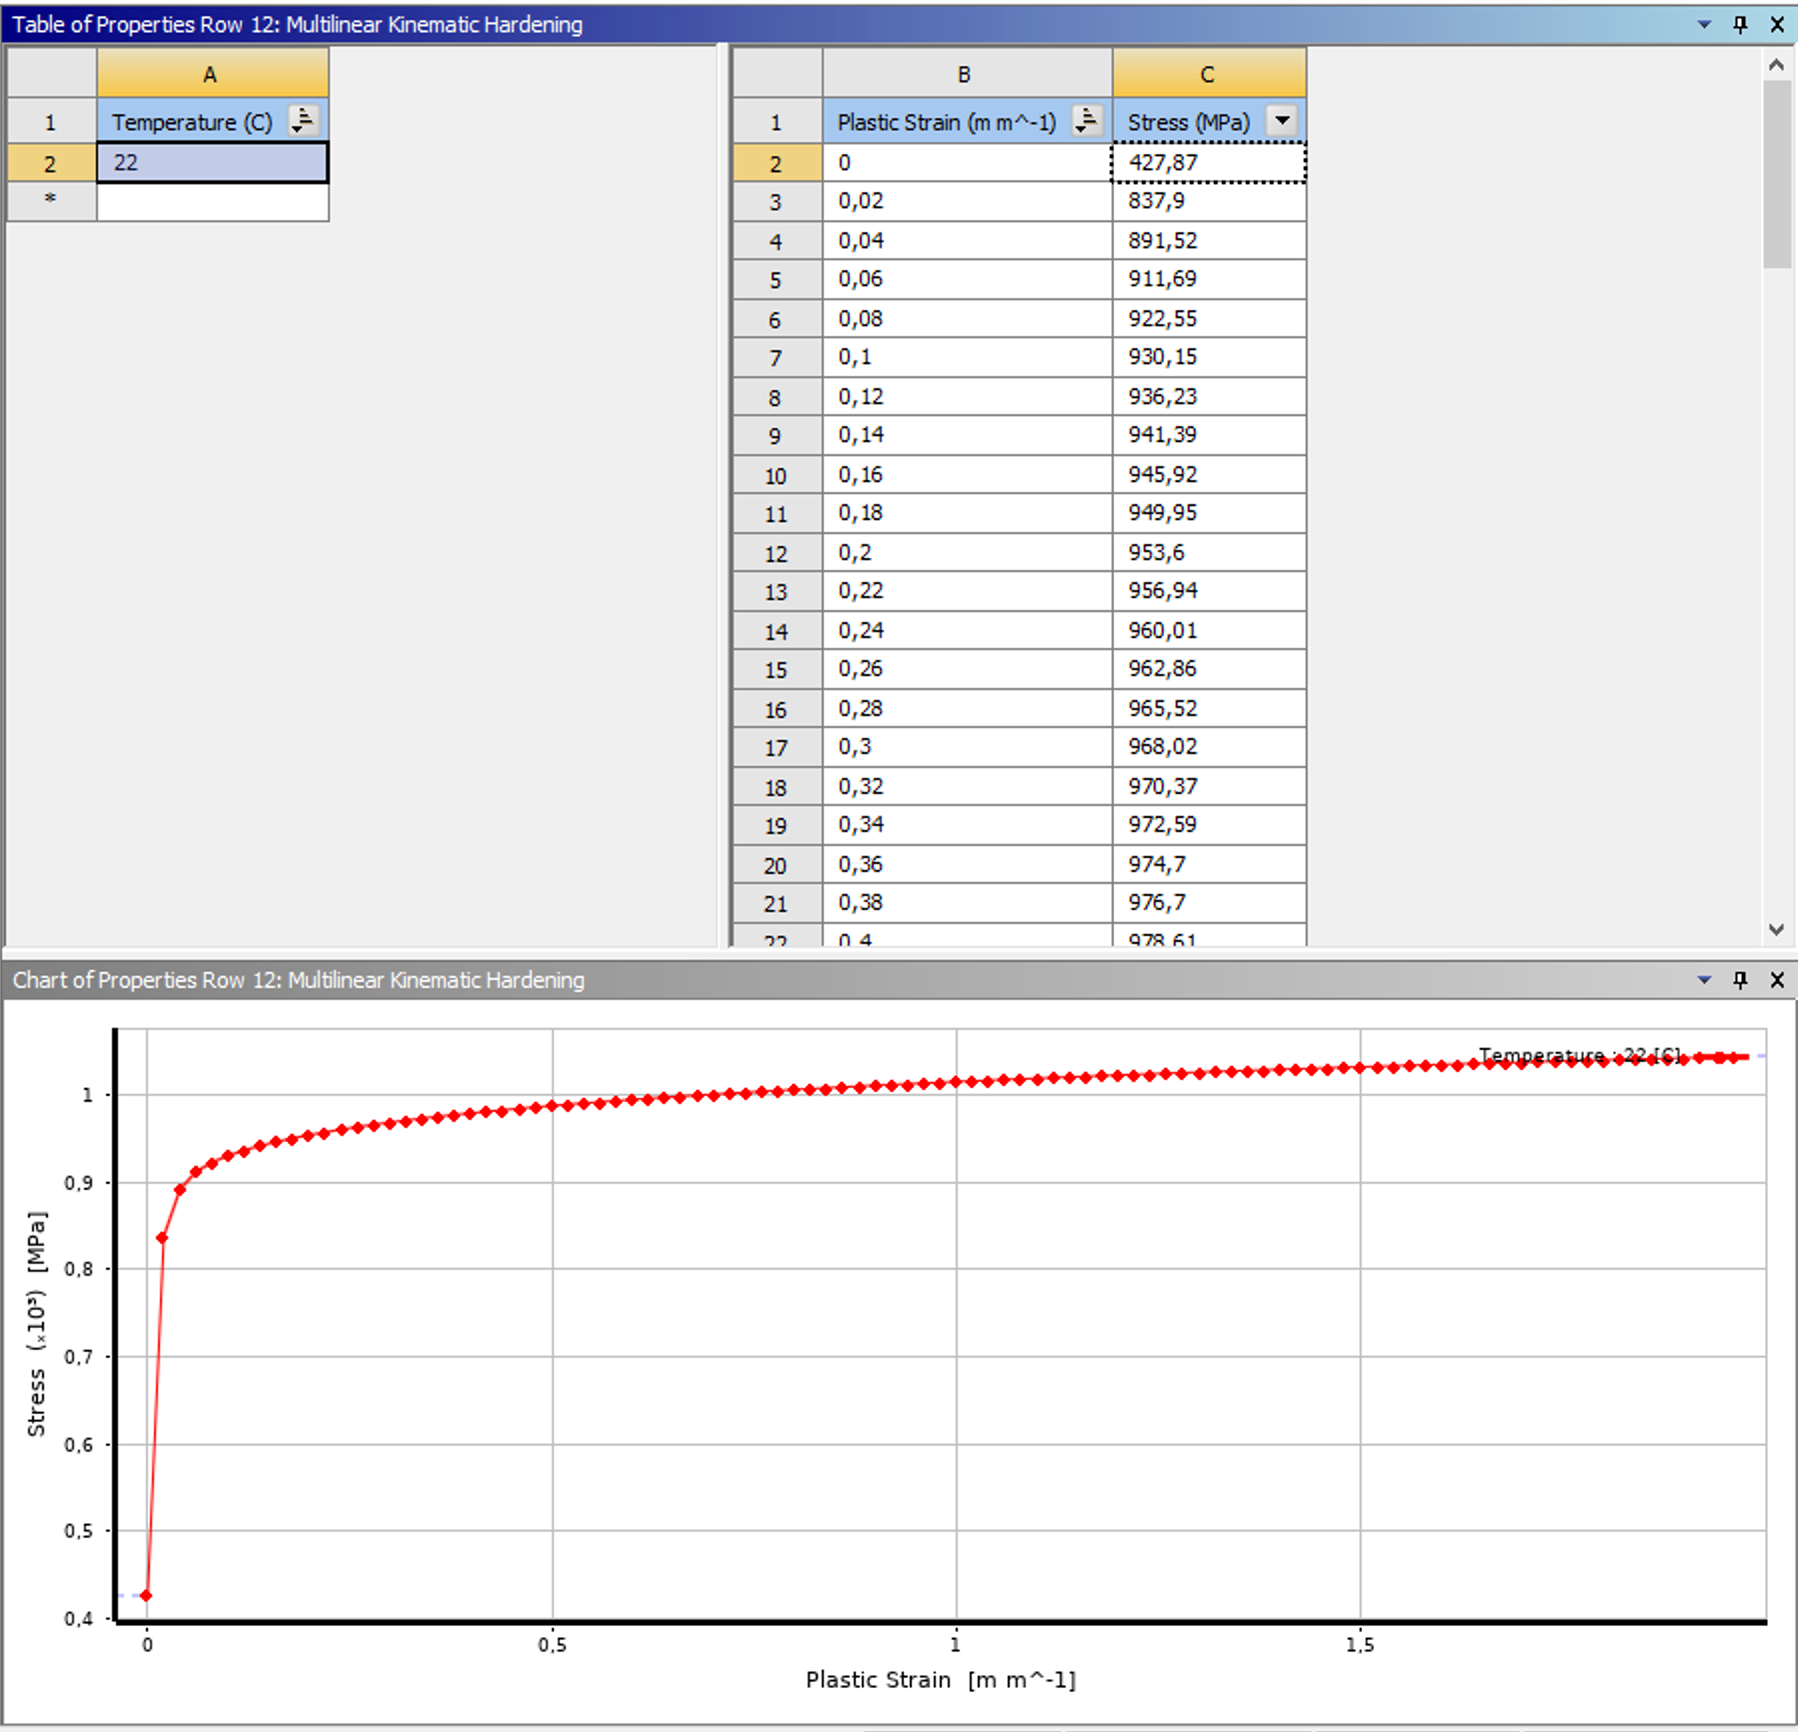
Could you describe how you defined the hardening curve (stress versus plastic strain) in the Engineering Data? If you don't expect reverse loading to activate kinematic hardening effects, I would suggest that you employ "Multilinear Isotropic Hardening" instead.
-
October 2, 2024 at 3:48 pm
-
-
October 2, 2024 at 5:00 pm
Armin
Ansys EmployeeThanks Sebastian. To my opinion, you need to input more data points in the small strain region. Check how the stress jumps from ~427 MPa to ~827 MPa from zero to 0.02 strain. You need to add more intermediate values in this range otherwise Ansys Mechanical software will linearly interpolate your data. This may explain the discrepancy in validating your simulation against experimental data (in your first post) that shows up as a linear curve in the small strain regime.
-
October 3, 2024 at 6:57 am
uiluj
SubscriberThank you very much, that was actually the problem.
-
-
- You must be logged in to reply to this topic.


-
3467
-
1057
-
1051
-
929
-
896

© 2025 Copyright ANSYS, Inc. All rights reserved.


