TAGGED: ansys-apdl, ansys-mapdl, apdl, APDL-thermal
-
-
November 4, 2024 at 7:56 am
Amr 007
SubscriberHello everyone,
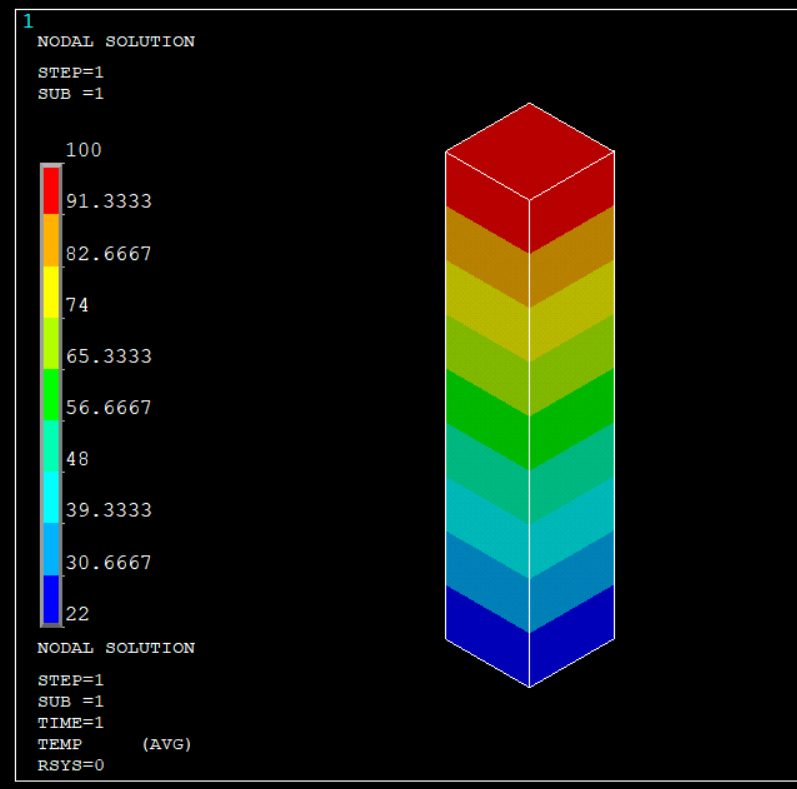
I’m encountering an issue with the contour legend in ANSYS MAPDL. Specifically, the legend appears inversed when I change its position from the bottom to the right side of the plot. In this inverted state, the maximum temperature is displayed at the bottom of the legend, while the minimum temperature is at the top.
This problem consistently occurs whenever I reposition the legend. I’ve attached illustrations to better explain the issue:
Illustration 1: Contour legend at the bottom (correct orientation).
Illustration 2: Contour legend at the right (inversed orientation).
Has anyone else experienced this problem? If so, how did you resolve it? Any insights or suggestions would be greatly appreciated.
Thank you in advance for your help!
-
November 4, 2024 at 10:06 am
Erik Kostson
Ansys EmployeeHi
As far as seen this is the way it shows the contour legend when you set it to left or right of window (/udoc command).
Do not think there is much that can be done as it is the way it is done in this case (we will still check if there is some form of workaround).
All the best
Erik
-
November 5, 2024 at 5:08 pm
Bill Bulat
Ansys EmployeeHello there,
Erik posted your request internally to us, his coworkers. After a lot of trial and error, I came up with something that might work for you:
Please copy the listing below into a text file and then read that file into an interactive MAPDL session with the /INPUT command.
fini/cle/vie,1,1,1,1/vup,1,z/prep7 ! TEST MODELbloc,,1,,1,,5et,1,278mp,kxx,1,60vmes,allnsel,s,loc,zd,all,temp,22nsel,s,loc,z,5d,all,temp,100allsfini/solu ! SOLVEallssolvfini/post1 ! POST PROCESSINGC*** FIRST CONTOUR PLOT USING DEFAULT COLORS, LEGEND NOT DISPLAYED/plo,info,3/plo,leg3,offplns,temp/wait,2*get,minval,plns,,min ! minval = LOWEST NUMBER IN PREVIOUS CONTOUR PLOT*get,maxval,plns,,max ! maxval = HIGHEST NUMBER IN PREVIOUS CONTOUR PLOTC*** SECOND CONTOUR PLOT, ONLY LEGEND DISPLAYED w/REVERSED NUMBERS AND COLORS/noe ! DON'T ERASE SCREEN/plo,leg3,on ! DISPLAY LEGEND THIS TIME/foc,1,5,,,1 ! SEND MODEL OUT OF FRAME OF GRAPHICS WINDOW/udoc,1,cntr,left ! DISPLAY CONTOUR LEGEND ON LEFT/contour,1,9,maxval,(maxval-minval)/9,minval ! REVERSE NUUMBERING ON CONTOUR LEGEND/COLOR,CNTR,RED,1 ! REVERSE COLOR ASSIGNMENT ON CONTOUR LEGEND/COLOR,CNTR,ORAN,2/COLOR,CNTR,YELL,3/COLOR,CNTR,YGRE,4/COLOR,CNTR,GREE,5/COLOR,CNTR,GCYA,6/COLOR,CNTR,CYAN,7/COLOR,CNTR,CBLU,8/COLOR,CNTR,BLUE,9plns,temp ! CREATE CONTOUR PLOT (MODEL NOT SHOWN, JUST LEGEND)/reset ! RESET ALL GRAPHICS SETTINGS/eofI hope this works for you.Kind regards,
Bill
-
November 12, 2024 at 8:20 am
Amr 007
SubscriberHi,
Thank you for your response. Your code successfully allows for the correct contour legend. However, the graphics can’t be updated. I hope this problem will be fixed in the next release.
Have a nice day.
-
-
- You must be logged in to reply to this topic.


-
3407
-
1057
-
1051
-
896
-
877

© 2025 Copyright ANSYS, Inc. All rights reserved.


