

-
-
November 25, 2021 at 12:21 am
sblee
SubscriberHello,
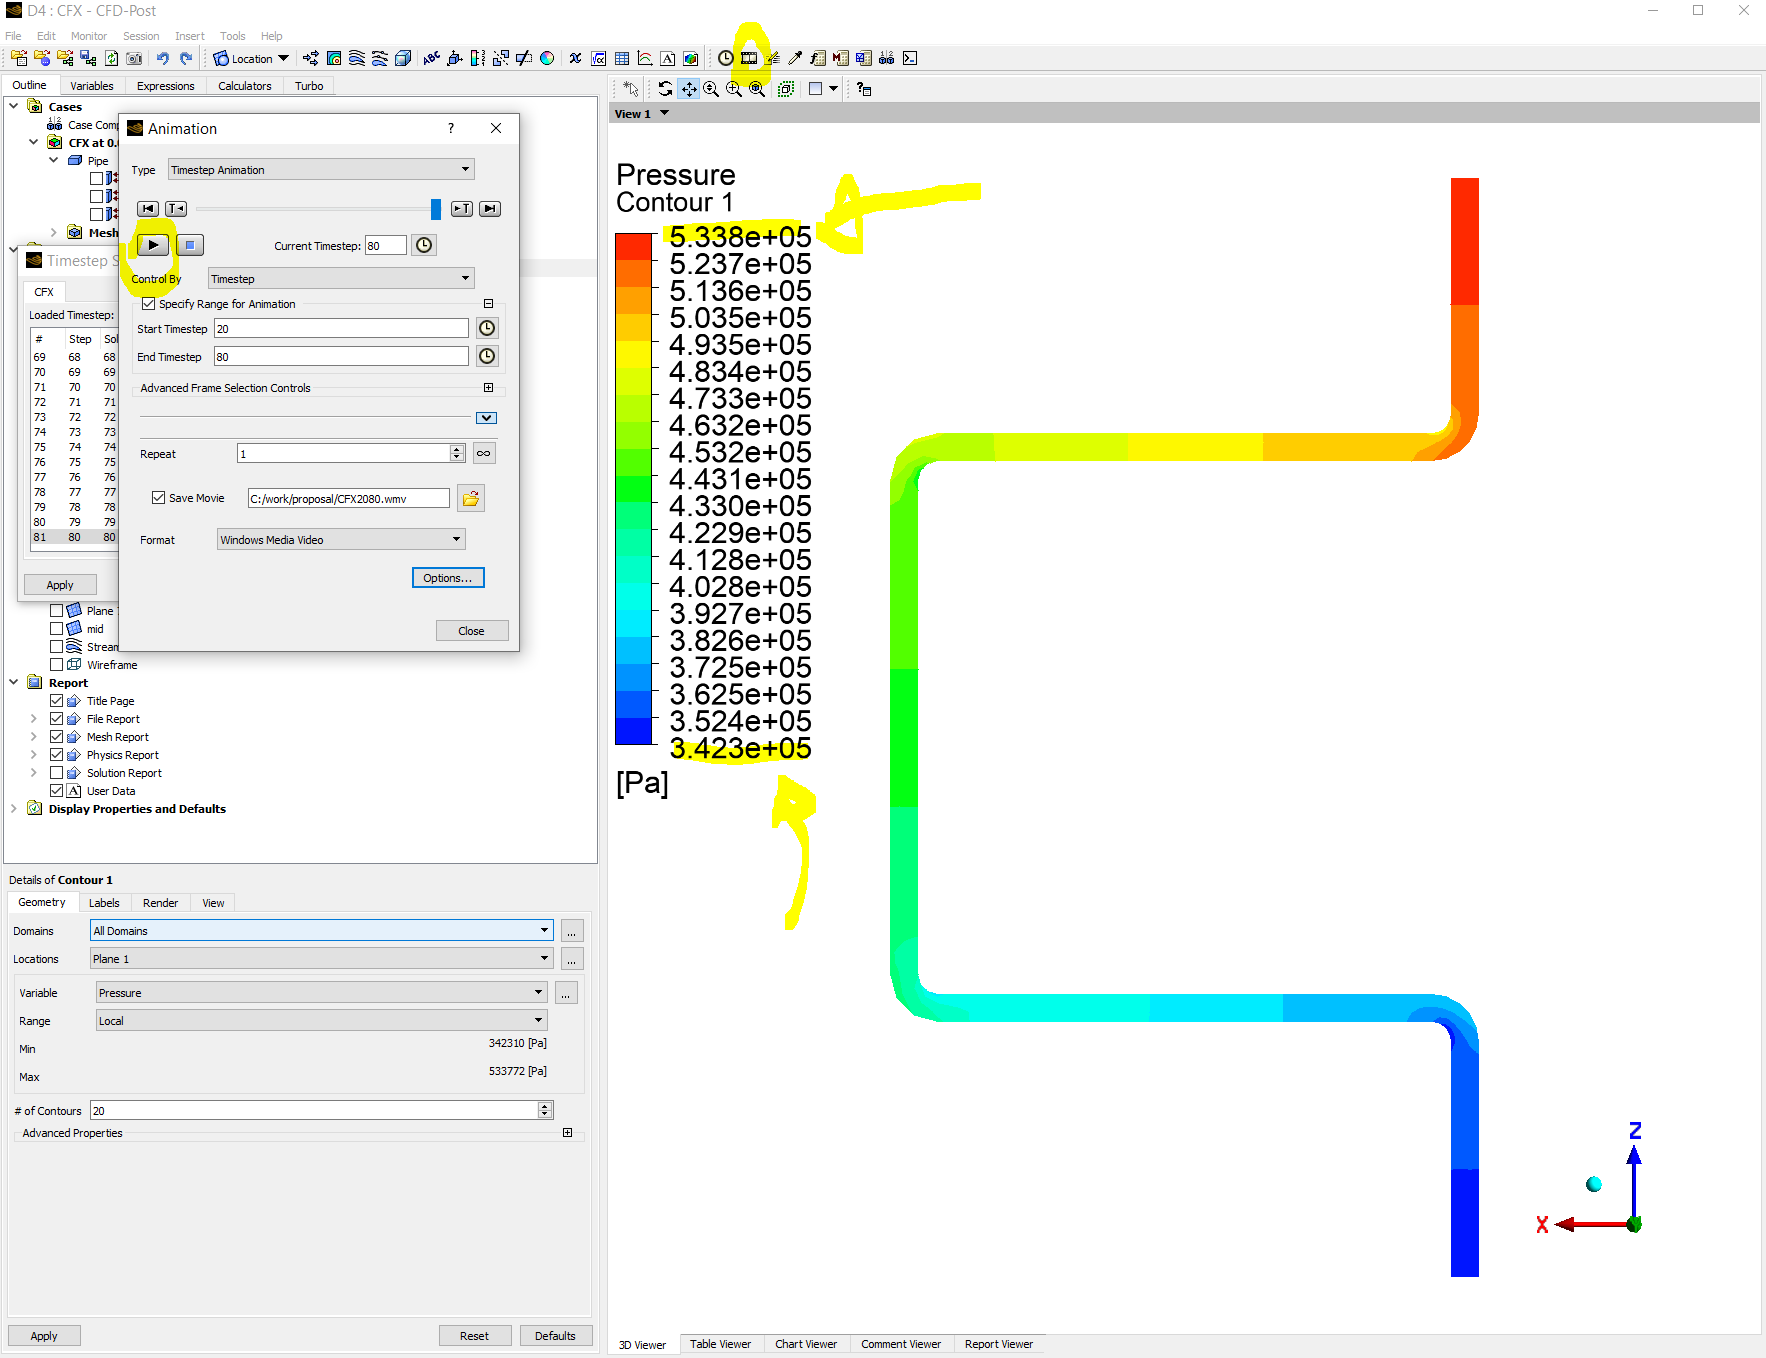
I am using cfx-post to review time-varying pressure contour.
The legend (color bar) numbers keep changing when I animate the pressure contour. See image below.
How to user-define max/min of the legend (color bar) in cfx-post? So the max/min does not change through the animation.
Thanks.
November 25, 2021 at 2:12 pmAmine Ben Hadj Ali
Ansys EmployeeYou restrict the plot to a fixed range (to be selected under "Range" to "User Specified")
November 29, 2021 at 4:24 pmSubscriberThanks!
December 1, 2021 at 7:18 amAnsys EmployeeWelcome!
Viewing 3 reply threads- The topic ‘how to user-define max/min of the legend (color bar) in cfx-post?’ is closed to new replies.
Innovation Space Trending discussions
 Top Contributors
-
peteroznewman
 4838
4838 -
scabo
 1587
1587 -
Dennis Chen
 1386
1386 -
javat33489
 1242
1242 -
Shyam Prasad V Atri
1021
Top Rated Tags
© 2026 Copyright ANSYS, Inc. All rights reserved.
Ansys does not support the usage of unauthorized Ansys software. Please visit www.ansys.com to obtain an official distribution.
-


The Ansys Learning Forum is a public forum. You are prohibited from providing (i) information that is confidential to You, your employer, or any third party, (ii) Personal Data or individually identifiable health information, (iii) any information that is U.S. Government Classified, Controlled Unclassified Information, International Traffic in Arms Regulators (ITAR) or Export Administration Regulators (EAR) controlled or otherwise have been determined by the United States Government or by a foreign government to require protection against unauthorized disclosure for reasons of national security, or (iv) topics or information restricted by the People's Republic of China data protection and privacy laws.


