-
-
November 26, 2024 at 6:49 am
derek1414
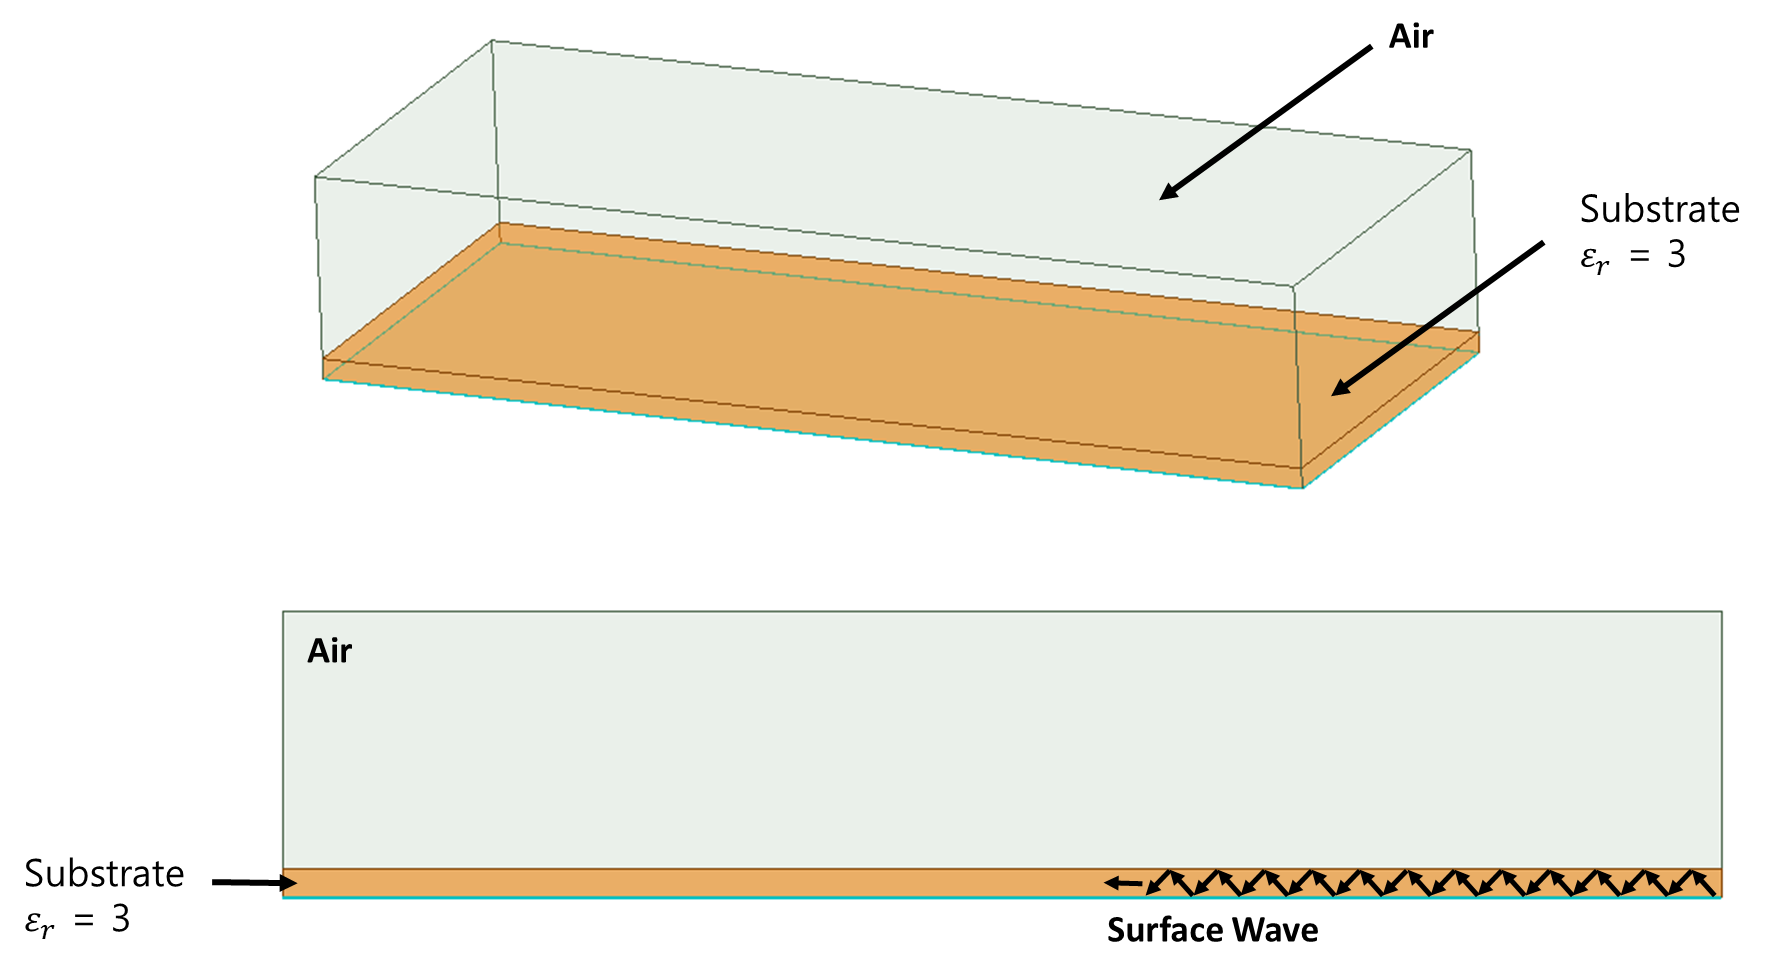
SubscriberI would like to know how to plot the propagation constant in a typical microstrip structure, as shown in the image.
The goal is to determine the propagation constant of the surface wave generated under specific permittivity and substrate height conditions.
I have seen tutorials on YouTube explaining how to plot the propagation constant in waveguides, but I am unsure how to configure the ports and boundaries for a microstrip structure.
For reference, I have set up the HFSS configuration as shown in the image.
How can I plot the propagation constant of the surface wave ?
-
November 26, 2024 at 1:57 pm
ErKo
Ansys EmployeeHio
For the plot see the video at about 2min:30sec - 3min:30sec in the video:
https://www.youtube.com/watch?v=hrvqryGbwLo
As for the BC perhaps some forum members can chime in here:
Perhaps the below helps:
https://www.youtube.com/watch?v=1iKE7gwyakM
All the best
Erik
-
- You must be logged in to reply to this topic.


- Three-Phase Voltage Imbalances in dual stator electric generator
- Link the Circuit to 3D Terminals
- Magnetic Dipole moment calculation
- Core Loss in ANSYS MAXWELL Eddy Current solution
- exporting and importing my Netlist for my external circuit
- Error of Metal Fraction in Icepak Classic.
- The unit of theta in Is*sin(2*pi*fre*Time+theta-2*pi/3)
- simplorer-maxwell

-
4633
-
1540
-
1386
-
1225
-
1021

© 2025 Copyright ANSYS, Inc. All rights reserved.


